Fig. 9.
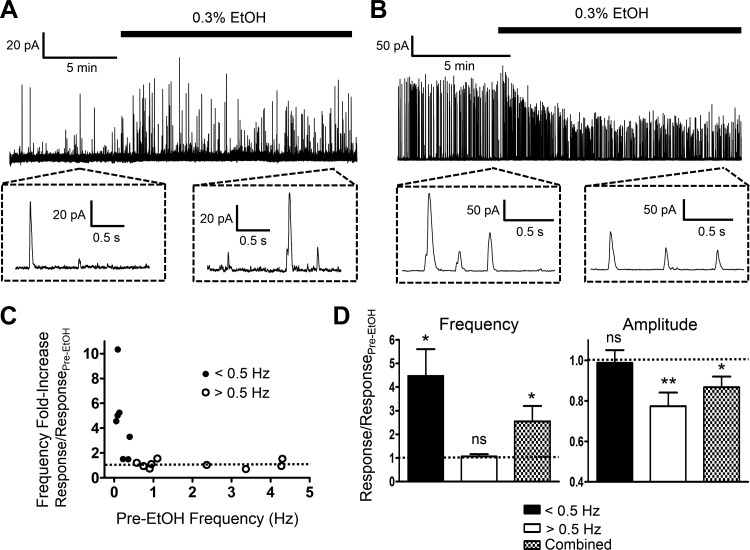
Regulation of transient BK currents (TBKCs) by EtOH in native DSM cells. A and B: representative recordings in DSM cells, which exhibited a low (A) or a high (B) level of basal TBKC activity, showing differential responses to 0.3% EtOH. Insets depict TBKCs on an expanded time scale. C: summary graph of the increase in TBKC frequency vs. basal activity for each of the 17 recorded cells (N = 13). Cells with the basal activity of TBKCs of <0.5 Hz (low-frequency TBKC DSM cells) showed enhancement in the frequency. Dotted line represents the control level. D: summary of the effects of 0.3% EtOH on the frequency and amplitude of TBKCs for low-frequency TBKC DSM cells defined by the threshold activity level of <0.5 Hz (n = 8, N = 8), high-frequency TBKC DSM cells with >0.5 Hz (n = 9, N = 7), and for all DSM cells combined (n = 17, N = 13). For both the frequency and amplitude of TBKCs, the y-axis describes the fold increase over pre-EtOH control. Dotted lines represent the control levels. Statistically significant effects were noted as shown; *P < 0.05; **P < 0.01; and ns, nonsignificant vs. pre-EtOH control values.

