Fig. 3.
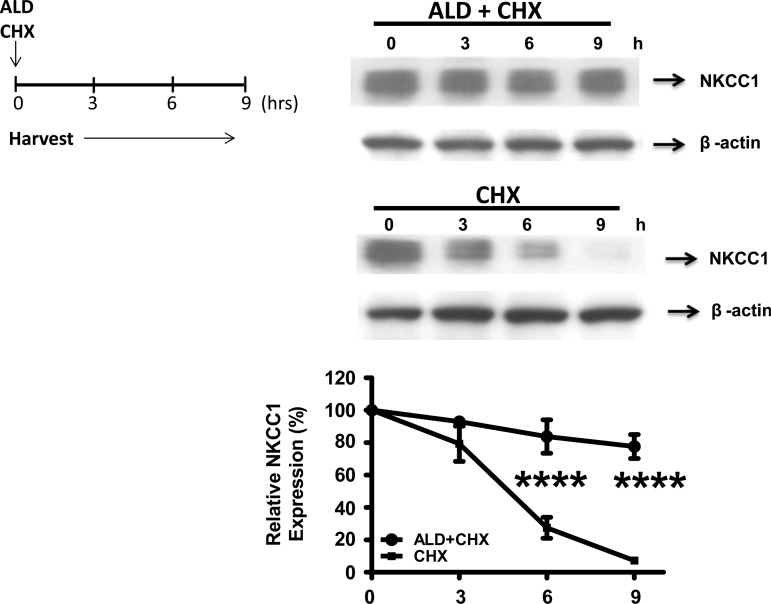
Role of ALD in NKCC1 protein induction and stability. Cell lysates were analyzed by gel electrophoresis and Western blot analysis. Blots were probed with antibodies against NKCC1, and β-actin served as the control. HT-29 cells were stimulated with ALD (1 μM) and then either treated or not treated with the protein synthesis inhibitor cycloheximide (CHX; 20 μg/ml) for 3, 6, or 9 h. Western blots (top) showing NKCC1 protein expression in HT-29 cells treated with the above protocol. The relative expression of NKCC1 as a function time since the ALD treatment (x-axis) is summarized by a line graph from 3 independent experiments (bottom). Line graph expression levels are normalized to 100%, relative to the vehicle alone. Statistical significance: ****P < 0.0001.

