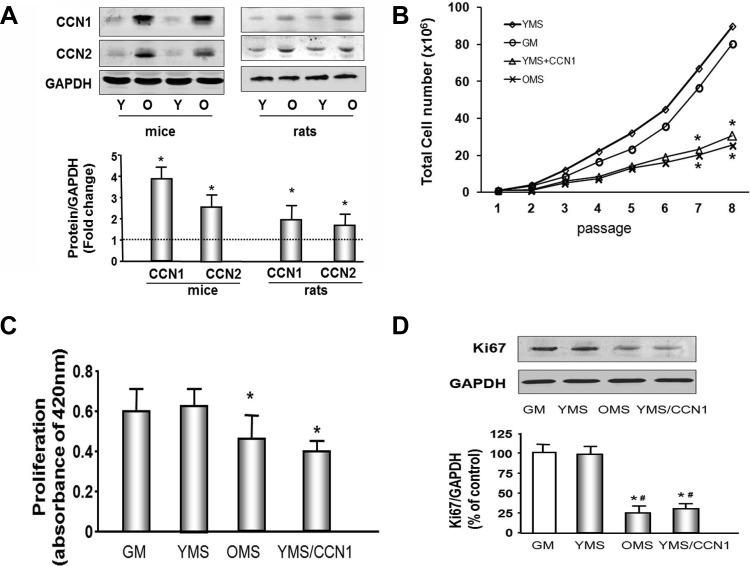
Fig. 1.
CCN1 and CCN2 are increased in aging muscle and muscle progenitor cell (MPC) proliferation is decreased by CCN1 or aging mouse serum. A: representative Western blots of hindlimb muscle from old (O) and young (Y) rodents show increased CCN1 and CCN2 protein in aging muscle. Bar graph shows mean band density ± SE for CCN1 or CCN2 expressed as a fold change from levels in young rodents (set to 1-fold) after normalization to the density of GAPDH (bars: means ± SE; n = 6; *P < 0.05 vs. young). B: MPCs were cultured in Ham's F-10 medium containing 20% FBS [growth medium (GM); ○], medium with 20% young mouse serum (YMS; ◇), 20% old mouse serum (OMS; X), or YMS plus recombinant CCN1 (5 μg/ml; YMS + CCN1; △) and passaged every 3 days for 8 passages (x-axis). The cell total number was measured by hemocytometer at each passage, (n = 9; *P < 0.05 vs. GM or YMS). C: MPCs were grown in Ham's F-10 medium containing 20% FBS (GM), 20% YMS, 20% OMS, or YMS plus recombinant CCN1. The cell proliferation rate was measured using a chromogenic assay kit. (n = 9; *P < 0.05 vs. GM or YMC). D: Ki67, a proliferation marker, was assessed by Western blot in MPCs. GAPDH was determined as a loading control. Bar graph shows the mean band density of Ki67 bands expressed as a percentage of the control level (growth medium with BSA as 100%) after normalization to the density of GAPDH (bars: means ± SE; n = 6; *P < 0.05 vs. GM; #P < 0.05 vs. YMS).

