Fig. 3.

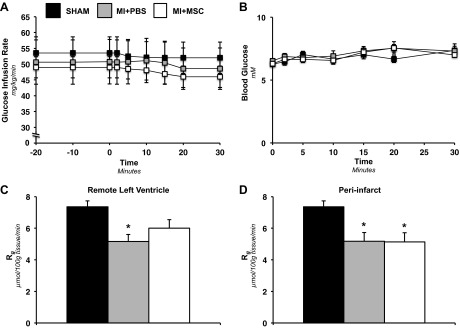
Insulin-stimulated whole body disposal and cardiac-specific glucose uptake. A: glucose infusion rate (GIR) during the insulin clamp. The GIR is equivalent to the whole body glucose disposal rate in response to venous infusion of insulin. The GIR is shown as a time course starting 20 min before administration of 2-[14C]DG (−20-min time point) to 30 min following 2-[14C]DG infusion (30-min time point). B: arterial blood glucose concentration following 2-[14C]DG for 30 min postadministration. Values are means ± SE for n = 6–10 mice/group. Metabolic index of glucose uptake (Rg) in the remote left ventricle (LV; C) and Rg in the peri-infarct (PI) region of the LV (D) are shown. Cardiac Rg values are relative to brain Rg. Values are means ± SE; n = 6–8 mice/group. *P < 0.05 vs. Sham.
