
Fig. 1.
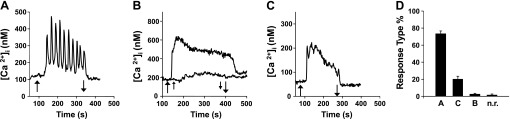
Patterns of intracellular of Ca2+ signaling in Ca2+-sensing receptor (CaR)HEK-293 cells. Starting from a resting concentration of 1.5 mM CaCl2, CaRHEK-293 cells were perfused with a solution containing 3 mM CaCl2 (upward arrow) for 200–300 s as indicated before return to perfusion containing 1.5 mM CaCl2 (downward arrow). A: typical tracing of an oscillatory response induced by increasing extracellular Ca2+ concentration ([Ca2+]e). B: peak and plateau response without intracellular Ca2+ concentration ([Ca2+]i) oscillations. Bottom trace: perfusion with 2.25 mM CaCl2. C: in some cases the pattern shown in B was preceded by [Ca2+]i spikes of diminishing amplitude. D: percentage of cells with each type of response (756 cells; n.r., not responding). In subsequent figures, the results are presented as the percentage of oscillating and nonoscillating cells in the population.