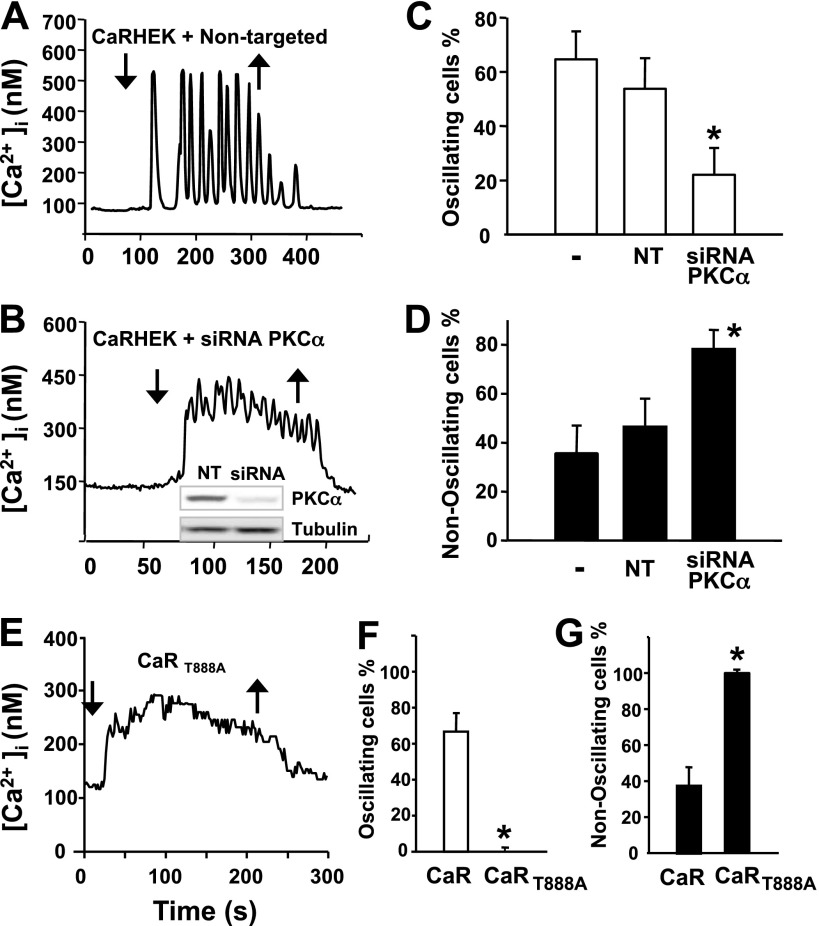
Fig. 6.
A–D: knockdown of PKCα reduced [Ca2+]e-evoked [Ca2+]i oscillations in CaRHEK-293 cells. From a resting [Ca2+]e of 1.5 mM, [Ca2+]e was increased to 3.0 mM (downward arrows). Upward arrows show return to 1.5 mM [Ca2+]e. A: typical individual tracing of [Ca2+]i vs. time from a CaRHEK-293 cell transfected with nontargeted oligonucleotides. B: typical [Ca2+]e-evoked [Ca2+]i response in a cell transfected with siRNA targeting PKCα. Inset: cells lysates were analyzed by SDS-PAGE and immunoblotting with a PKCα polyclonal antibody and total β-tubulin to verify equal gel loading. C and D: data summary for all 187 analyzed cells in control (-), nontargeted (NT), and siRNA PKCα (siRNA PKCα) conditions. E–G: HEK-293 cells expressing CaRT888A displayed nonoscillatory [Ca2+]i responses even in response to a small increase in [Ca2+]e. E: CaRHEK-293 cells expressing wild-type CaR and HEK-293 cells expressing CaRT888A were stimulated by raising [Ca2+]e to 2.25 mM (downward arrow). Upward arrow shows return to 1.5 mM [Ca2+]e. F and G: bars represent the data summary for 225 cells. *Confidence intervals were not overlapping with control confidence intervals.

