Fig. 14.
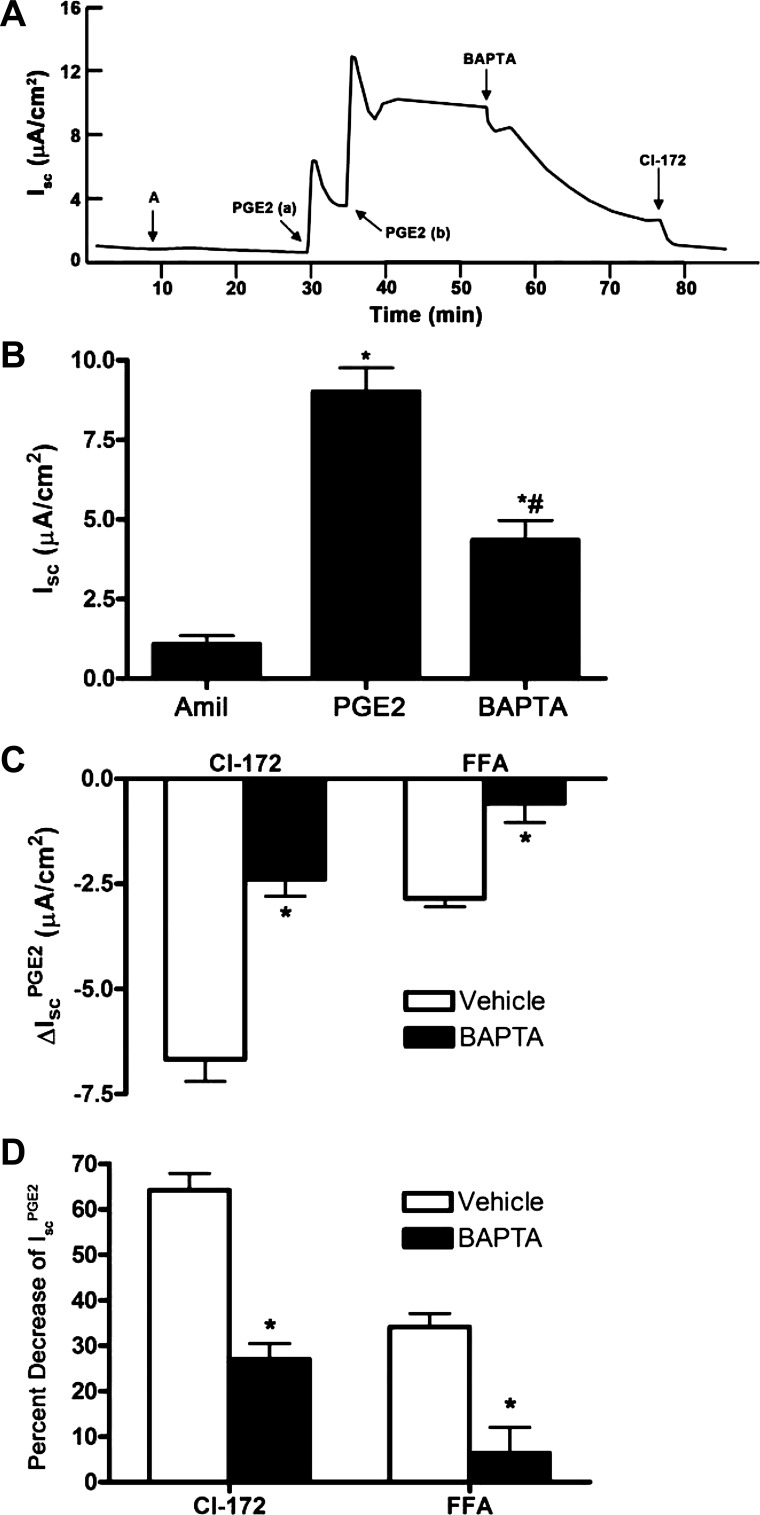
Effect of the Ca2+ chelator BAPTA-AM on PGE2-induced Isc in mIMCD-K2 cells. A: representative trace shows the Isc response to the addition of BAPTA-AM (5 × 10⁻⁵ M) to both sides on PGE2-induced Isc (IscPGE2). B: average Isc responses to sequential addition of amiloride, PGE2 (to the basal bath), and BAPTA-AM. Values are means ± SE (n = 12 filters). *Value significantly different from that in amiloride-treated cells; #value significantly different from IscPGE2 in control cells. C: inhibition of PGE2-induced Isc (ΔIscPGE2) after apical addition of CI-172 and FFA to cells pretreated with vehicle (open bars) or BAPTA-AM (solid bars). Values are means ± SE (n = 6 filters). *Values significantly different from ΔIscPGE2 in vehicle-treated cells. D: percentage of inhibition of PGE2-induced Isc (IscPGE2) after apical addition of CI-172 and FFA to cells pretreated with vehicle or BAPTA-AM. Values are means ± SE (n = 6 filters). *Values significantly different from percent decrease in IscPGE2 in vehicle-treated cells.

