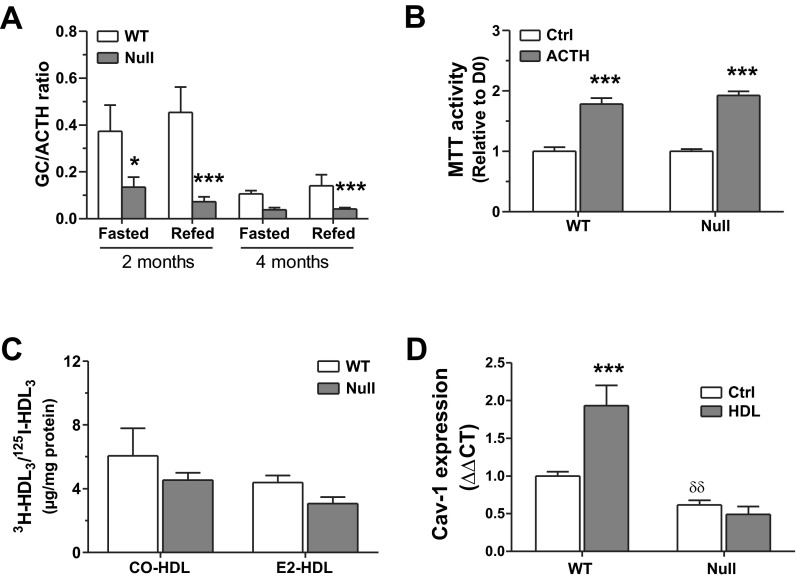
Fig. 6.
Impact of high ACTH or high HDL3 on Scarb1 null MSCs. A: corticosterone induction index by ACTH in fasted and fed states; Bonferroni post hoc test, *P < 0.05 and ***P < 0.001 vs. WT. Plasma were harvested from 4–8 mice/group. B: proliferation response of WT and null marrow-derived MSCs grown with or without 10 nM ACTH for 10 days; Bonferroni post hoc test, ***P < 0.001. Values are from 3 independent cell preparations. C: selective cholesteryl oleate (CO) and estradiol (E2) uptake from HDL3 particles in WT and null MSCs. Data are averages ± SE from 3–6 independent cell preparations. D: gene expression of caveolin-1 (Cav1) in WT and null MSCs in control conditions (Ctrl) and following stimulation for 24 h with HDL3 (150 μg/ml). Data are averages ± SE from 4–6 independent cell preparations. ***P < 0.001, significant differences vs. Ctrl; δδP < 0.05, significant differences vs. WT; Bonferroni post hoc test.

