Fig. 1.
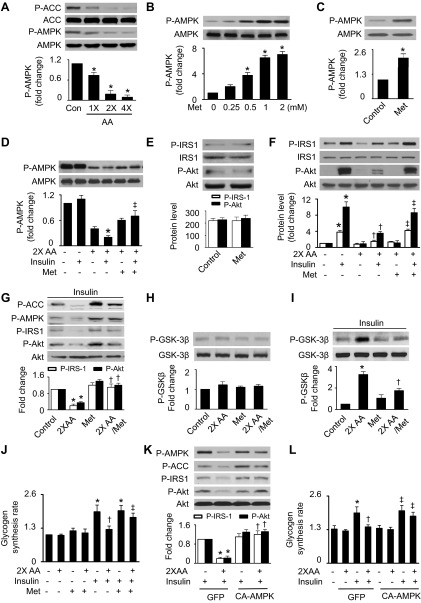
Activation of AMP-activated protein kinase (AMPK) attenuates excess amino acid (AA)-induced insulin resistance in HepG2 cells. A: HepG2 cells subjected to serum and AA starvation were treated with indicated concentrations of AA for 1 h. Phosphorylation of AMPK (Thr172) and acetyl-CoA carboxylase (ACC; Ser79) was analyzed by Western blot (WB) (*P < 0.05 vs. control; n = 6). B: cells were treated with the indicated concentrations of metformin (Met) for 1 h in the presence of normal concentrations of AA, and the expression of phosphorylated AMPK (P-AMPK) and total AMPK was assessed by WB (*P < 0.05 vs. control; n = 6). C: the effect of Met (2 mM) on AMPK phosphorylation was determined by WB in the absence of AA (*P < 0.05). D: cells were pretreated with Met (2 mM) for 1 h and then stimulated with insulin (100 nm) for 15 min in the presence or absence of 2× AA. Phosphorylation of AMPK was analyzed by WB (*P < 0.05 vs. control and ‡P < 0.05 vs. 2× AA/insulin; n = 4). E: the effects of Met on phosphorylated insulin receptor substrate-1 (P-IRS-1)-Tyr612 and phosphorylated Akt (P-Akt)-Ser473 were determined by WB. F: insulin-stimulated phosphorylation of IRS-1 and Akt was analyzed by WB (*P < 0.05 vs. control, †P < 0.05 vs. 2× AA, and ‡P < 0.05 vs. 2× AA/insulin; n = 4). G: protein levels of P-AMPK, P-IRS-1, and P-Akt were analyzed by WB (*P < 0.05 vs. control and †P < 0.05 vs. 2× AA; n = 4). H and I: expression of P-GSK-3β (Ser9) were detected by WB (*P < 0.05 vs. control and †P < 0.05 vs. 2× AA; n = 4). J: glycogen synthesis was assayed as described in materials and methods (*P < 0.05 vs. control, †P < 0.05 vs. 2× AA, and ‡P < 0.05 vs. 2× AA/insulin; n = 4). K: the cells transfected with GFP or constitutively active AMPK (CA-AMPK) adenovirus were treated with insulin (100 nM) and 2× AA. Protein levels of P-AMPK, P-IRS-1, and P-Akt were analyzed by WB [*P < 0.05 vs. green fluorescent protein (GFP)/insulin and †P < 0.05 vs. 2× AA/insulin/GFP; n = 4]. L: glycogen synthesis was assayed as described in materials and methods (*P < 0.05 vs. GFP/insulin, †P < 0.05 vs. 2× AA/insulin/GFP, and ‡P < 0.05 vs. 2× AA/insulin; n = 4).

