
Fig. 3.
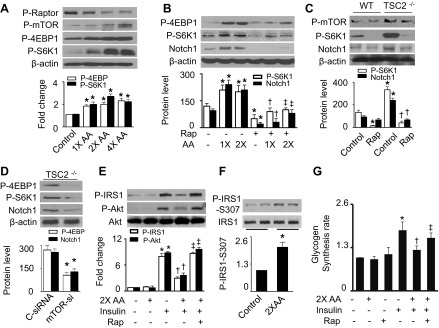
Elevated AA activate Notch1 by stimulating mammalian target of rapamycin (mTOR) signaling. A: HepG2 cells were treated with the indicated concentrations of AA for 1 h. Expression of P-Raptor (Ser792), P-mTOR-Ser2448, phosphorylated S6 kinase 1 (P-S6K1)-Thr389, phosphorylated 4E-binding protein 1 (P-4EBP1)-Thr37, and β-actin was analyzed by WB (*P < 0.05 vs. control; n = 4). B: cells were pretreated with rapamycin (Rap; 100 nM) for 1 h and then stimulated with the indicated concentrations of AA. Expression of P-S6K1, P-4EBP1, Notch1, and β-actin was determined by WB (*P < 0.05 vs. control, †P < 0.05 vs. 1× AA, and ‡P < 0.05 vs. 2× AA; n = 4). C: wild-type (WT) and tuberous sclerosis complex 2 (TSC2)−/− mouse embryonic fibroblasts (MEFs) were treated with Rap (100 nM) for 24 h. Cell lysates were subjected to WB to determine the expression of P-mTOR, P-S6K1, Notch1, and β-actin (*P < 0.05 vs. WT control and †P < 0.05 vs. TSC2−/− control; n = 4). D: TSC2−/− MEFs were transfected with C-siRNA or mTOR siRNA (mTOR-si) for 48 h. Expression of P-S6K1, P-4EBP1, Notch1, and β-actin was analyzed by WB (*P < 0.05; n = 3). E: insulin-stimulated phosphorylation of IRS-1 and Akt in HepG2 cells was measured by WB (*P < 0.05 vs. control, †P < 0.05 vs. 2× AA, and ‡P < 0.05 vs. 2× AA/insulin; n = 4). F: phosphorylation of IRS-1 at Ser307 was assayed by WB (*P < 0.05; n = 3). G: glycogen synthesis was assayed as described in materials and methods (*P < 0.05 vs. control, †P < 0.05 vs. 2× AA, and ‡P < 0.05 vs. 2× AA/insulin; n = 4).