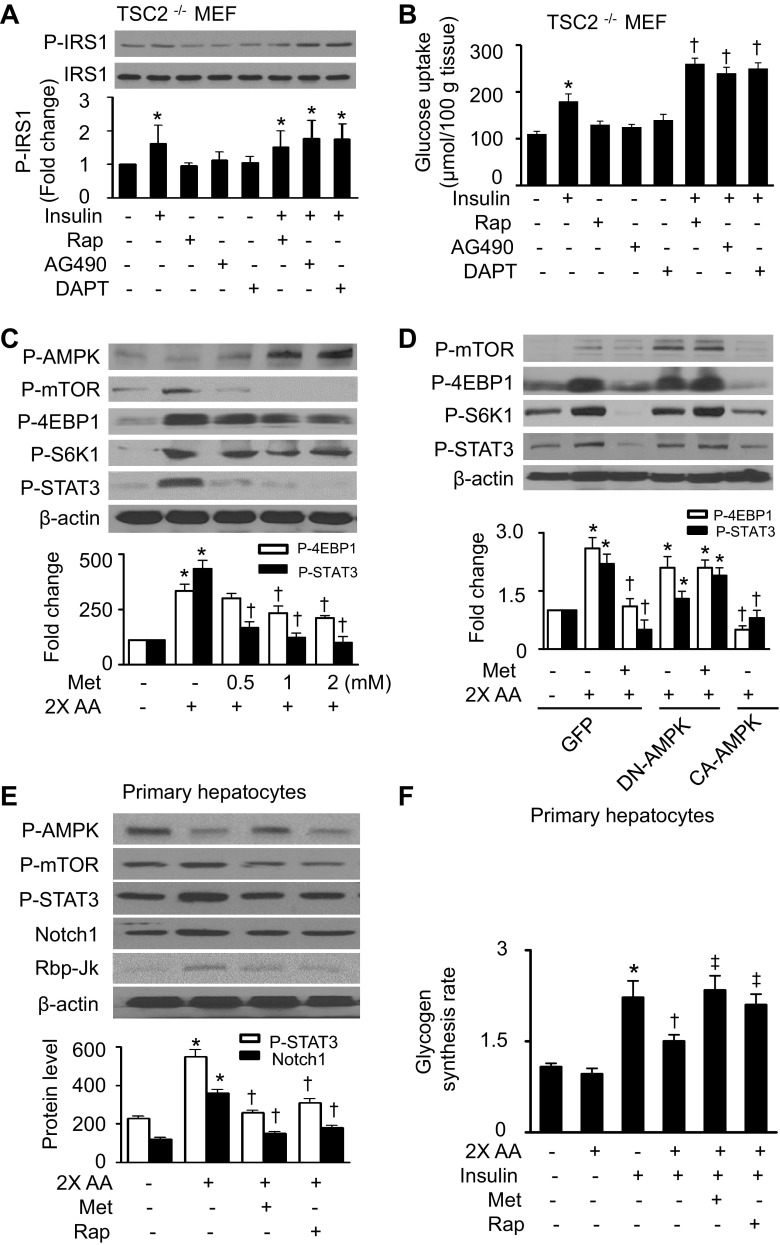
Fig. 5.
Activation of AMPK by Met inhibits mTOR/STAT3 signaling. A: TSC2−/− MEFs were pretreated with Rap (100 nM), AG490 (50 μM), or DAPT (10 μM) for 24 h and then stimulated with insulin (100 nM) for 10 min. Protein levels of P-IRS-1 and IRS-1 were detected by WB (*P < 0.05 vs. control; n = 4). B: glucose uptake was determined as described in materials and methods (*P < 0.05 vs. control and †P < 0.05 vs. insulin; n = 4). C: protein levels of P-AMPK, P-mTOR, P-S6K1, P-4EBP1, P-STAT3, and β-actin were analyzed by WB in HepG2 cells (*P < 0.05 vs. control and †P < 0.05 vs. 2× AA; n = 4). D: HepG2 cells that were infected with adenovirus encoding GFP, DN-AMPK, or CA-AMPK overnight were treated with metformin and 2× AA for 1 h. Expression of P-mTOR, P-4EBP1, P-S6K1, P-STAT3, and β-actin was assayed by WB (*P < 0.05 vs. GFP and †P < 0.05 vs. GFP/2× AA; n = 3). E: mouse primary hepatocytes were treated with Met (2 mM) or Rap (100 nM) for 1 h in the presence or absence of 2× AA. Protein levels of P-AMPK, P-mTOR, P-STAT3, Notch1, and Rbp-Jκ were assessed by WB (*P < 0.05 vs. control and †P < 0.05 vs. 2× AA; n = 3). F: glycogen synthesis in mouse primary hepatocytes was assayed as described in materials and methods (*P < 0.05 vs. control, †P < 0.05 vs. insulin, ‡P < 0.05 vs. 2× AA/insulin; n = 4).

