Fig. 1.
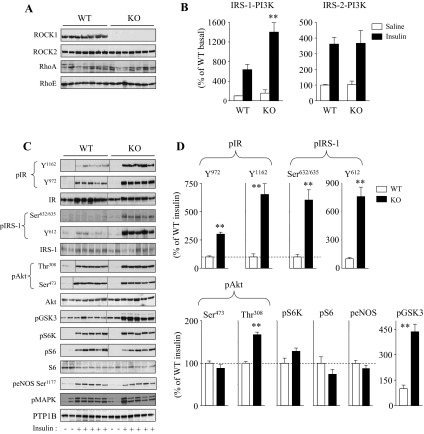
Molecular analysis of insulin signaling in adipose tissue of Rho kinase-1 (ROCK1)−/− mice. A: immunoblot analysis of ROCK1 in adipose tissue of WT and ROCK1−/− (KO) mice. Adipose tissue lysates were subjected to SDS-PAGE and immunoblot with antibodies for ROCK1, ROCK2, RhoA, and RhoE. B: PI3K activity in adipose tissue of WT and ROCK1−/− mice. After an overnight fast, 4-mo-old female mice were injected ip with saline (open bars) or 10 U/kg insulin (filled bars). After 10 min, adipose tissue was removed. Adipose tissue lysates were subjected to immunoprecipitation with IRS-1 or an IRS-2 antibody. PI3K activity was measured and quantitated using a phosphorimager. C: insulin signaling in adipose tissue of WT and ROCK1−/− mice. Adipose tissue lysates were subjected to SDS-PAGE and immunoblot with antibodies as indicated. Bands were quantitated using densitometry and normalized by total protein levels. Note: blots for pIR (Y1163 and Y972), IR, pIRS-1(Y612), pAkt (Thr308 and Ser473), Akt, pGSK3, pS6K, and pS6 are rearranged in the same blots, and lines in blots indicate rearrangement of the blots. D: quantitation of insulin-signaling molecules in adipose tissue of WT and ROCK1−/− mice. Immunoblots shown are representative of 3 blots per antibody. For each genotype, n = 4 for saline and n = 6–7 for insulin. Data are means ± SE. **P < 0.01 vs. WT mice.

