Fig. 2.
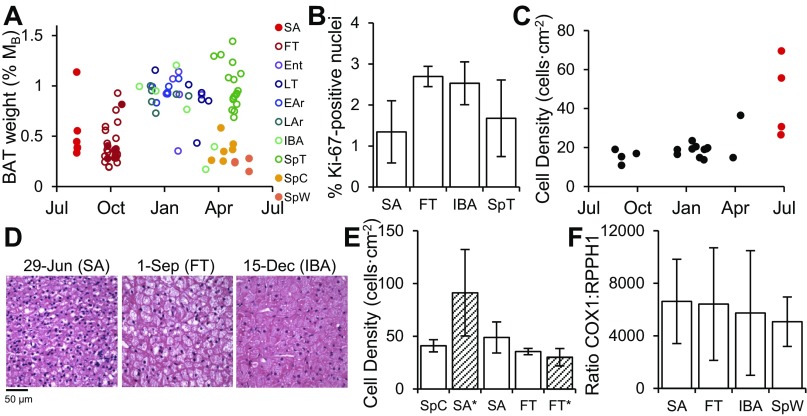
Annual cycles in 13-lined ground squirrel brown adipose morphology. A: axillary depot wet weight from tissues examined by proteomics expressed normalized to body mass (%MB); open circles represent heterotherms, while solid circles represent homeotherms. B: brown adipose tissue (BAT) cell proliferation indicated by mean ± SD. Ki-67-positive nuclei in fixed, paraffin-embedded histology samples was lowest in late-June SA ground squirrels, and peaked in FT (SA < FT Tukey P = 0.05, SA < IBA, P = 0.08; n = 3). SA, FT, and IBA squirrels were compared statistically, with n = 2 SpT animals plotted for comparison. C: cell densities, observed in paraffin-embedded, 5-μm sections of hematoxylin-and-eosin-stained BAT tissue, peaked in n = 4 summer-active (late-June) ground squirrels and were relatively stable across the remainder of opportunistically collected fixed tissues. D: representative H&E-stained paraffin sections from fixed BAT at three annual time points, 29-Jun (SA), 1-Sep (FT), and 15-Dec (IBA) illustrate high-cell density/small cell size of late-June SA ground squirrels. E: cell densities (± SD) across the homeothermic period from n = 4 SpC, SA (early August) and FT (torpor naïve) from cryosectioned samples obtained from our frozen tissue bank. Data from fixed tissues (n = 4; late-June SA and n = 3; torpor naïve FT) are represented by hatched bars and state labels with asterisk; these cell counts were normalized to the size and thickness of frozen sections for comparison. Cell densities were similar between terminally aroused SpC and early-August SA animals, which tended to be higher (i.e., have smaller cells) than FT (SA vs. FT, P = 0.06). By including the additional fixed-tissue time points, June-SA animals represent the annual minimum in cell size and indicate that SpC and SA samples used in proteomics occur in advance of and subsequent to this minimum. Cell densities for FT animals collected from both methods are included to demonstrate that the outlier June-SA densities are not based on a normalization artifact but rather reflect biological difference. F: ratio of mitochondrial to nuclear DNA content (± SD) in BAT did not vary across the annual cycle. Total DNA was isolated from frozen BAT tissue in n = 5 SA, n = 6 IBA and SpW, and n = 15 FT ground squirrels.

