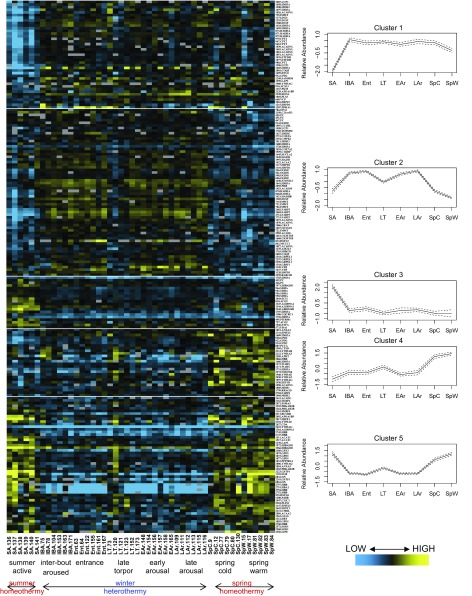
Fig. 3.
Heat map by sampled state. Protein spots that differed significantly among hibernation states by ANOVA (q < 0.05) and could be identified by LC-MS/MS were visualized by heat map to reveal five main patterns of change. The majority of differences in Clusters 2 and 5 distinguish between the summer and winter proteome of brown adipose tissue. On the x-axis, sampled animals are grouped by state. On the y-axis, protein spots are identified (spot number.spot identity). The mean (solid line) and 95% confidence interval (dashed lines) are presented for each cluster.

