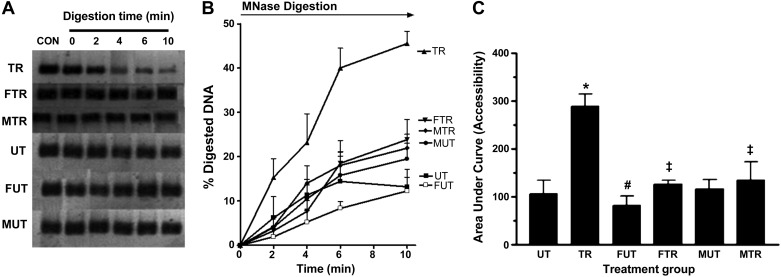
Fig. 4.
Accessibility of interlinker DNA within the 350-bp region containing the MEF2A binding site on the Glut4 promoter. Nuclei isolated from triceps muscle were incubated with MNase for the time periods indicated. CON (Control) represents reaction without MNase. Amount of DNA present at each time point was determined by PCR using primers that amplify a 350-bp segment containing the MEF2 binding site. PCR products obtained from each time point are shown in A. Signal intensity at each time point, which corresponds to the amount of DNA present, was used to calculate %digested DNA, which was plotted against time (B). %Digested DNA at each time point was calculated as follows: %digested DNA = (I0 − In)/I0 × 100, where In = signal intensity at any time point between 0 and 10 min and I0 = signal intensity at time point 0. Area under the %digested DNA curve (AUC), a measure of accessibility, was calculated using GraphPad Prism software (v. 3.0) and plotted in C. *P < 0.01 vs. UT; #P <0.05 vs. UT; ‡P < 0.05 vs. TR; n = 5 per group.

