
Fig. 1.
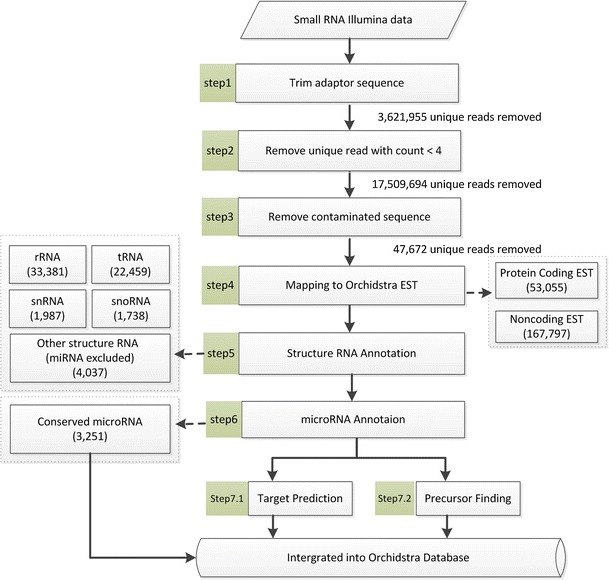
Annotation pipeline for small RNA reads and summary of results. Numbers in parentheses indicate the number of unique reads across all libraries. See Table 2 for the number of unique reads and total reads in each library
Official websites use .gov
A
.gov website belongs to an official
government organization in the United States.
Secure .gov websites use HTTPS
A lock (
) or https:// means you've safely
connected to the .gov website. Share sensitive
information only on official, secure websites.
Annotation pipeline for small RNA reads and summary of results. Numbers in parentheses indicate the number of unique reads across all libraries. See Table 2 for the number of unique reads and total reads in each library