
Fig. 1.
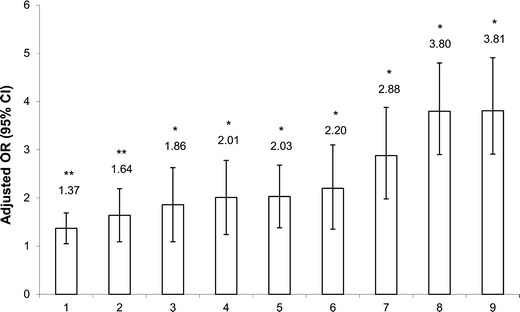
Associations between risk factors and adult overweight/obesity in the cross-sectional sample. Logistic regression was used and ORs were determined for the “at risk” compared to the “reference” groups of risk factors for the odds of having a body mass index greater than 25 kg/m2. Model adjusted for age, sex, and socioeconomic status. Legend of the x axis: 1 = high alcohol intake (≥10 g/day vs. 0 g/day), 2 = high dietary lipid intake (≥40 % fat/day vs. <30 % fat/day), 3 = non-consumption of multivitamin and dietary supplements (vs. consumer), 4 = high dietary restraint behavior (≥8 restraint score vs. ≤4 restraint score), 5 = non-participation in high-intensity physical activity (vs. ≥30 min/day), 6 = high susceptibility to hunger behavior (≥5 hunger score vs. ≤2 hunger score), 7 = low dietary calcium intake (<600 mg/day vs. ≥1,000 mg/day), 8 = high disinhibition eating behavior (≥6 disinhibition score vs. ≤3 disinhibition score) and 9 = short sleep duration (<6 hours/day vs. 7–8 h/day). OR, odds ratio; CI, confidence interval. n = 537 (230 men and 307 women). *P < 0.01; **P < 0.05. Figure adapted from Chaput et al. [58]