
Fig. 2.
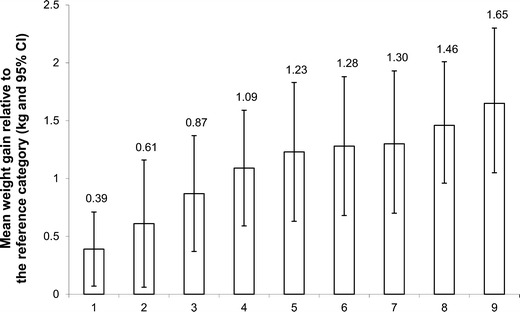
Mean weight gain above baseline weight over the 6-year follow-up period for individuals with the risk factor relative to the reference category. Model adjusted for age, sex, baseline body mass index, length of follow-up, socioeconomic status, and all other risk factors. Legend of the x axis: 1 = high alcohol intake (≥10 g/day vs. 0 g/day), 2 = high dietary lipid intake (≥40 % fat/day vs. <30 % fat/day), 3 = non-consumption of multivitamin and dietary supplements (vs. consumer), 4 = high dietary restraint behavior (≥8 restraint score vs. ≤4 restraint score), 5 = non-participation in high-intensity physical activity (vs. ≥30 min/day), 6 = high susceptibility to hunger behavior (≥5 hunger score vs. ≤2 hunger score), 7 = low dietary calcium intake (<600 mg/day vs. ≥1,000 mg/day), 8 = high disinhibition eating behavior (≥6 disinhibition score vs. ≤3 disinhibition score) and 9 = short sleep duration (<6 hours/day vs. 7–8 h/day). CI, confidence interval. n = 283. Figure adapted from Chaput et al. [58]