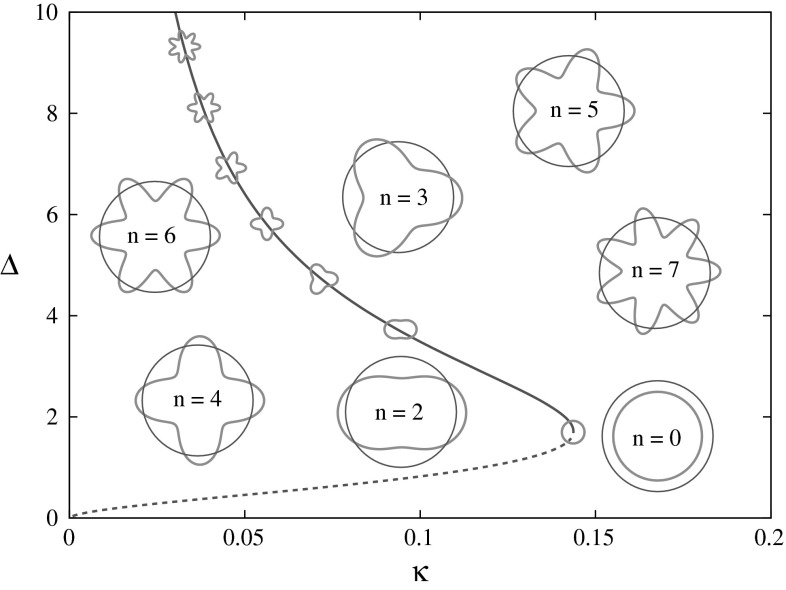
Fig. 2.
The bump width as a function of threshold κ, for the wizard hat weight distribution (11) with A = 1/4 and σ = 2, is shown by the continuous dark blue line. According to the linear radial instability analysis, the solid (dashed) line indicates a stable (unstable) branch of solutions. The azimuthal instability analysis predicts that solutions on the upper branch can also develop instabilities as the threshold is decreased leading to the formation of solutions exhibiting D n symmetry. The points of azimuthal instability are marked by glyphs in the shape of the corresponding mode (Color figure online)

