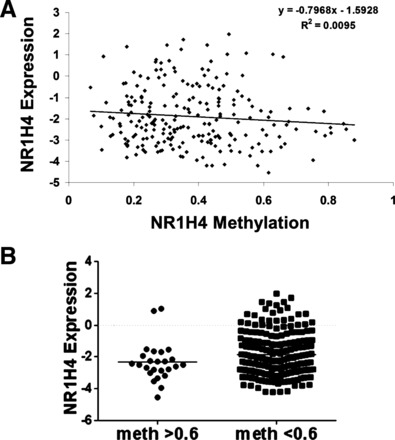
Fig. 5.

TCGA data analysis of the correlation of FXR promoter methylation and expression. A: correlation analysis of NR1H4 promoter methylation (x-axis) and NR1H4 expression (y-axis). There was no correlation between FXR promoter methylation and expression. B: comparison of FXR expression in tumors that had completely methylated FXR promoters (β-value > 0.6) or partially methylated/unmethylated. There is no statistically significant difference between these 2 groups.
