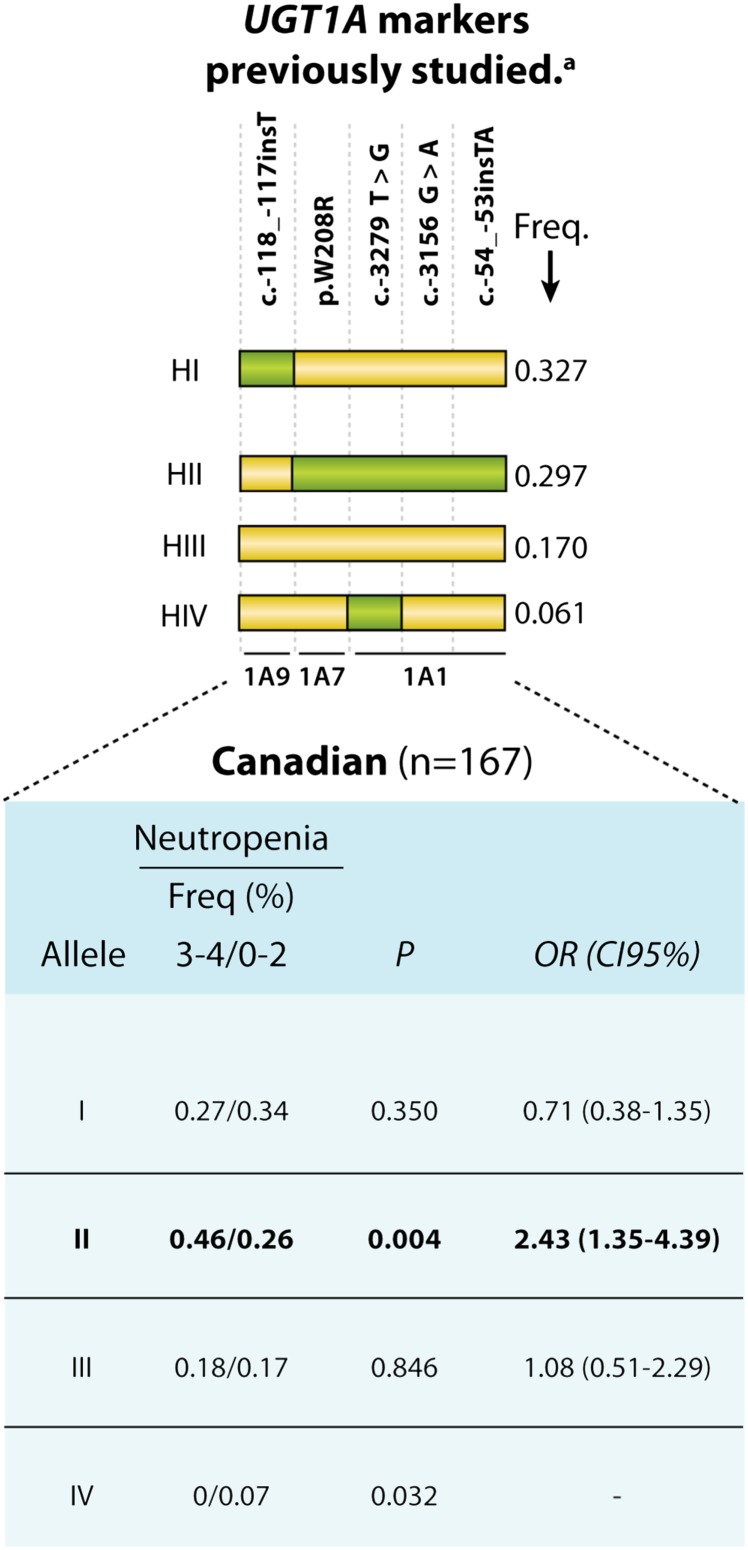
Fig. 1.
Schematic representation of UGT1A and the haplotype analyses associated with severe neutropenia based on previously investigated markers. Variations are represented by squares: a yellow square represents a reference nucleotide, whereas a green square represents a variant (relative to the AF297093 sequence). Only haplotypes with an MAF > 5% in the present study are shown. aBased on markers studied by Cecchin et al. (2009). CI95%, 95% confidence interval; Freq., frequency.

