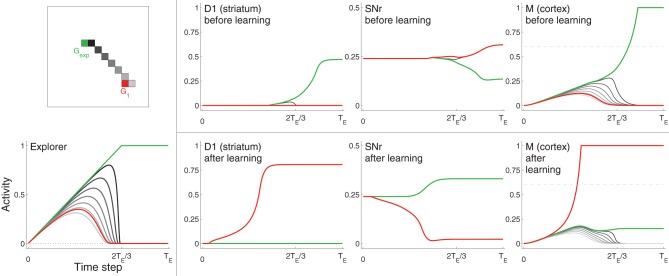
Figure 3.
Example neural activity for selected neurons from D1, SNr, and Cortex (M) at different points in training. Neurons are colored according to their spatial location in the grid (top left). The red neuron corresponds to the center of target G1, the green neuron corresponds to the location of Gexp (focus of excitation in Explorer), which is not within the target area. Other neurons, most of which are located in between the G1 and Gexp, are colored in gray (darker gray neurons are closer to Gexp). Bottom left: activities of Explorer neurons. Rightmost three graphs on top: activities of neurons from D1, SNr, and M before learning (i.e., before the target was hit). Rightmost three graphs on bottom: activities of the same neurons after learning, i.e., after the target was hit several times. Note that the maximum of the vertical axis of SNr is 0.5, while that of the other graphs is one. Horizontal dashed line of graphs for M (right) represents η.

