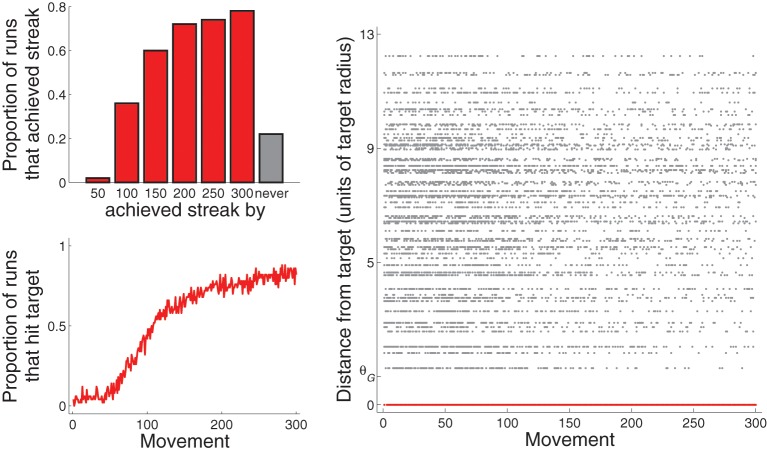
Figure 5.
Performance across all 50 runs for Experiment 1: A single target (and only BG biasing). Top left: proportion of runs that achieved streak of hitting target ten consecutive times by the movement 50, 100, 150, …, or 300. Note that the bar graphs are cumulative. Bottom left: proportion of runs that hit target as a function of movement number. Right: Distance from the center of the target (in units of target radius) of each movement from all 50 runs. That for movements that hit the target are drawn in red and are at value 0 of the vertical axis.

