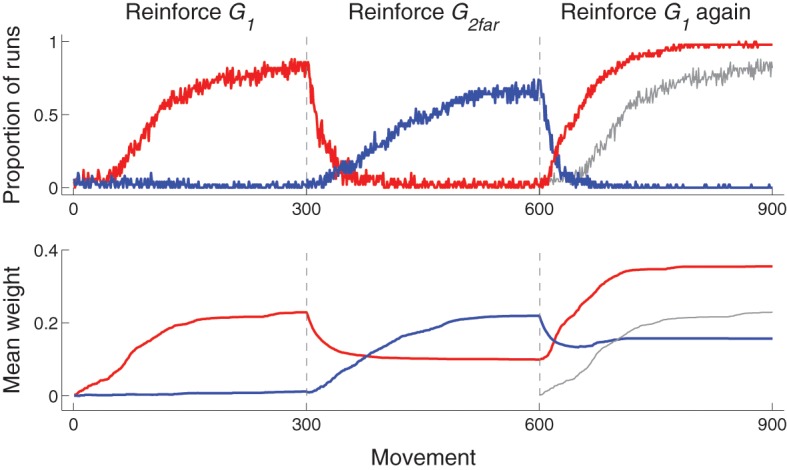
Figure 8.

Time-course of behavior and corticostriatal weights for Experiment 3: reinforce G1 (movements 1–300), then G2far (301–600), then G1 again (601–900). Top: proportion of runs that hit G1 (red) or G2far (blue) as a function of movement number. The proportion of runs that hit G1 during movements 1–300 are redrawn at horizontal positions 601–900 as a gray line for comparison of performance between initial acquisition (movements 1–300) and reacquisition (movements 601–900) of G1. Bottom: Mean (across runs) weight from Context neuron to the D1 neuron corresponding to most movements that hit G1 (red) or G2far (blue) for that particular run. The D1 neuron that corresponded to most movements that hit each target was determined by finding the maximum weight from Context to D1 neurons at the end of each 300 movement segment. Because several movements can hit each target, only runs in which the same D1 neuron was selected at movement 300 and movement 900 (i.e., for movements that hit G1) were included (16 out of 50 runs were excluded). That for weights from Context neuron to D2 neurons followed a similar pattern and are not plotted. Similar to the graphs in the top row, mean weight during movements 1–300 are plotted again at movements 601–900 in gray for comparison purposes.
