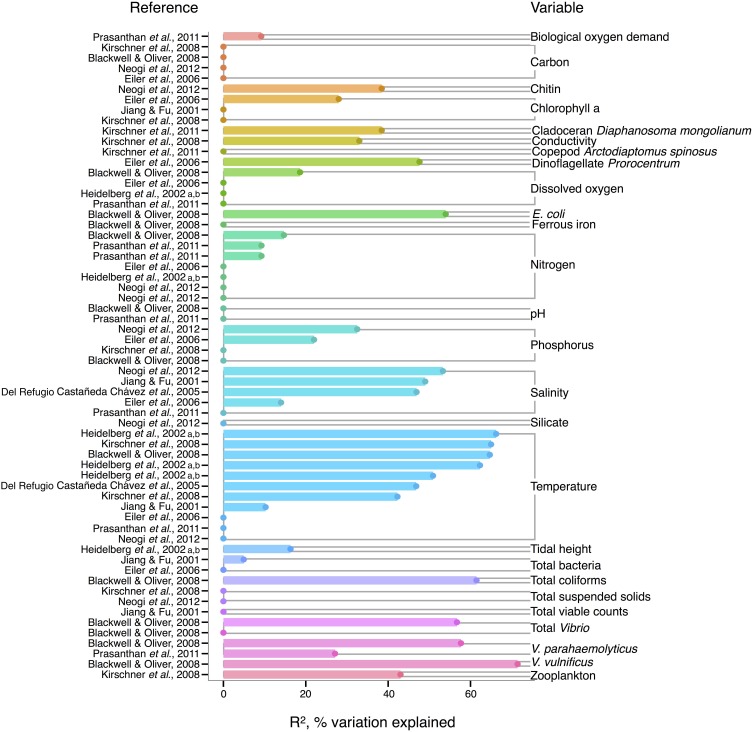
Figure 2.
Variation in V. cholerae abundance or percent positive samples is best explained by temperature, other organisms, and salinity. R2, or pseudo-R2, values from analyses across studies are depicted grouped by variable, and then in rank order, with their associated reference. A reference may conduct multiple analyses for a given variable (e.g., on subsets of data or considering different variables combinations for data regression). Dots indicate bar heights, and where a dot occurs without a bar, R2 was non-significant (i.e., R2 = 0).

