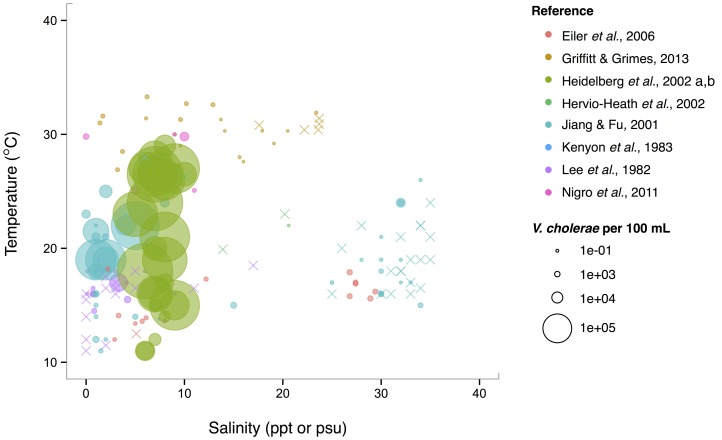
Figure 5.
V. cholerae favors lower salinity and occupies a broad temperature range. V. cholerae concentrations, i.e., MPN-estimated CFU or molecular marker gene copies per 100 mL, reported in different studies are plotted against the temperature (°C) and salinity values (ppt or psu) at which they were found. All studies report V. cholerae, including O1/O139 and non-O1/non-O139, except for Heidelberg et al. (2002a,b); DeLoney-Marino et al. (2003), whose genetic marker detected V. cholerae/V. mimicus. Circle (°) sizes correspond to concentrations, but note the breaks are scaled for clearer visualization, and not linearly. (×) indicates no V. cholerae found in that sample.

