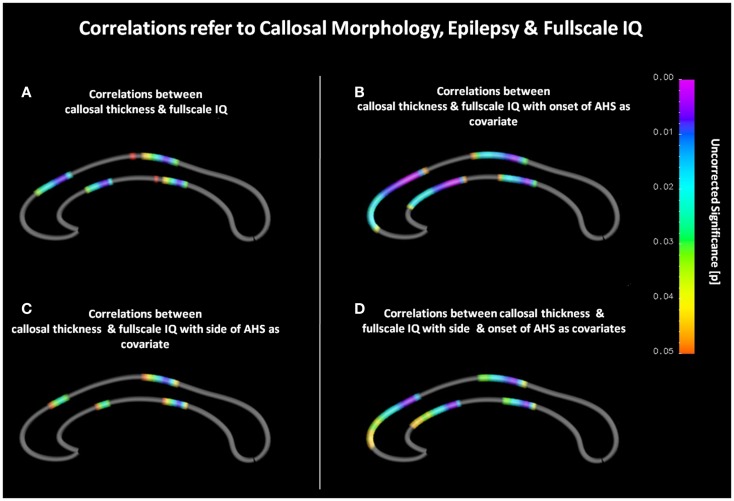
Figure 1.
(A) Correlations between callosal thickness und full-scale IQ. The color bar encodes the significant p-values (p ≤ 0.05). Gray color indicates where no significant correlations were detected. The anterior callosal region is located on the left, the posterior callosal region points to the right. (B) Correlations between callosal thickness and full-scale IQ with age at disease onset as covariate. (C) Correlations between callosal thickness and full-scale IQ with hemisphere of seizure occurrence as covariate. (D) Correlations between callosal thickness and full-scale IQ with onset and hemisphere as covariates.

