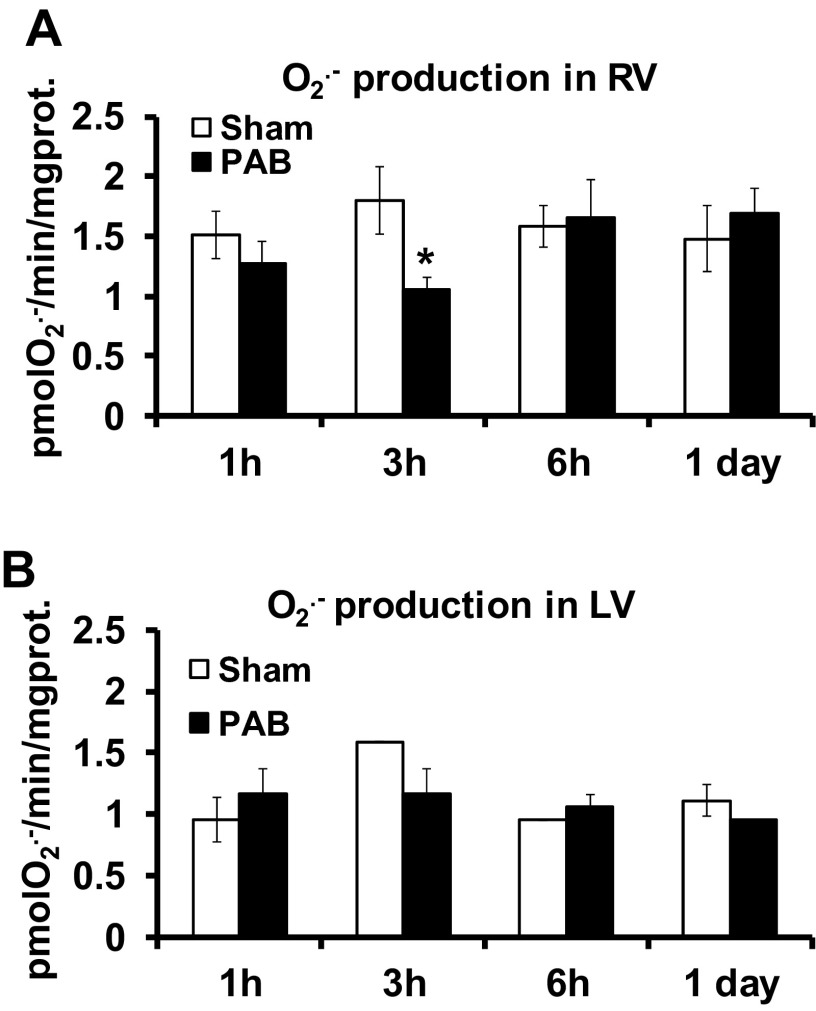
Fig. 2.
O2·− production does not change after PAB in RV and LV. To membrane fractions of RV and LV, 180 μM of NADPH were added to initiate the reaction of O2·− production. O2·− production was measured by the linear rate of SOD-inhibitable cytochrome c reduction in RV (A) and LV (B). Results are expressed as picomoles O2·− per minute per milligram protein (prot) as means ± SE; n = 3–5 animals. *P < 0.05 indicates significant difference vs. sham.

