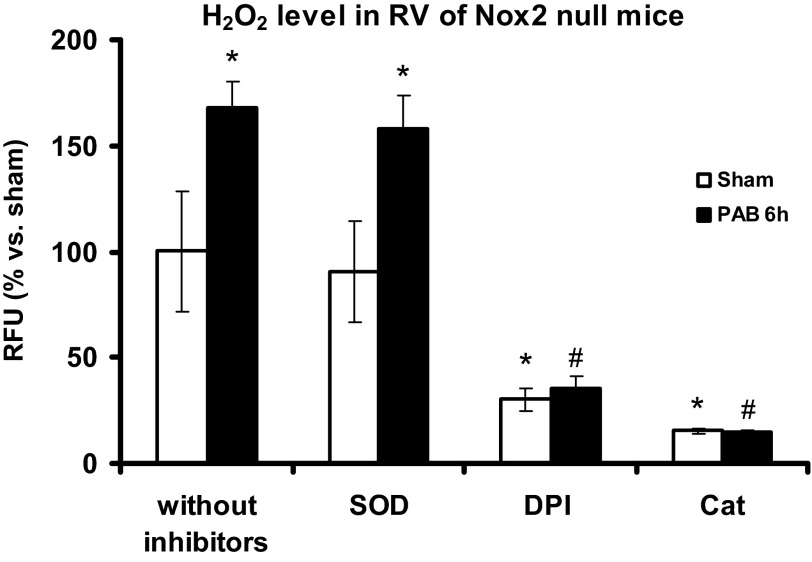
Fig. 7.
H2O2 levels in RV of Nox2 null mice after 6 h of PAB. Homogenates of RV from Nox2 null mice were preincubated with Cat (3,000 U/ml), SOD (200 U/ml), or DPI (20 μM), and H2O2 production was measured by Amplex Red fluorescence for 1 h and 30 min at 37°C. H2O2 production is expressed as percentage of RFU of the respective sham for each time point. Results are expressed as means ± SE; n = 3 animals. *P < 0.05 indicates significant difference vs. sham without inhibitors; #P < 0.05 indicates significant difference vs. PAB without inhibitors.

