
Fig. 8.
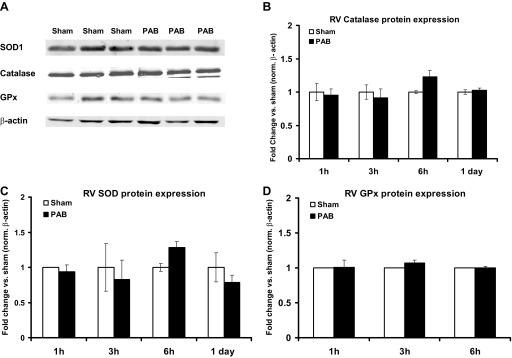
Catalase, SOD, and glutathione peroxidase (GPx) protein expression do not change after PAB. Catalase, SOD, and GPx protein expression were measured in RV after PAB by Western blot. β-Actin was used as a loading control. A: representative blots of protein expression in sham and PAB at 3 h. B–D: quantification of catalase (B), SOD (C), and Gpx (D) protein expression in response to PAB for the indicated times. Results are expressed as means ± SE of fold change from the respective sham for each time point; n = 3–6 animals. Norm, normalized.