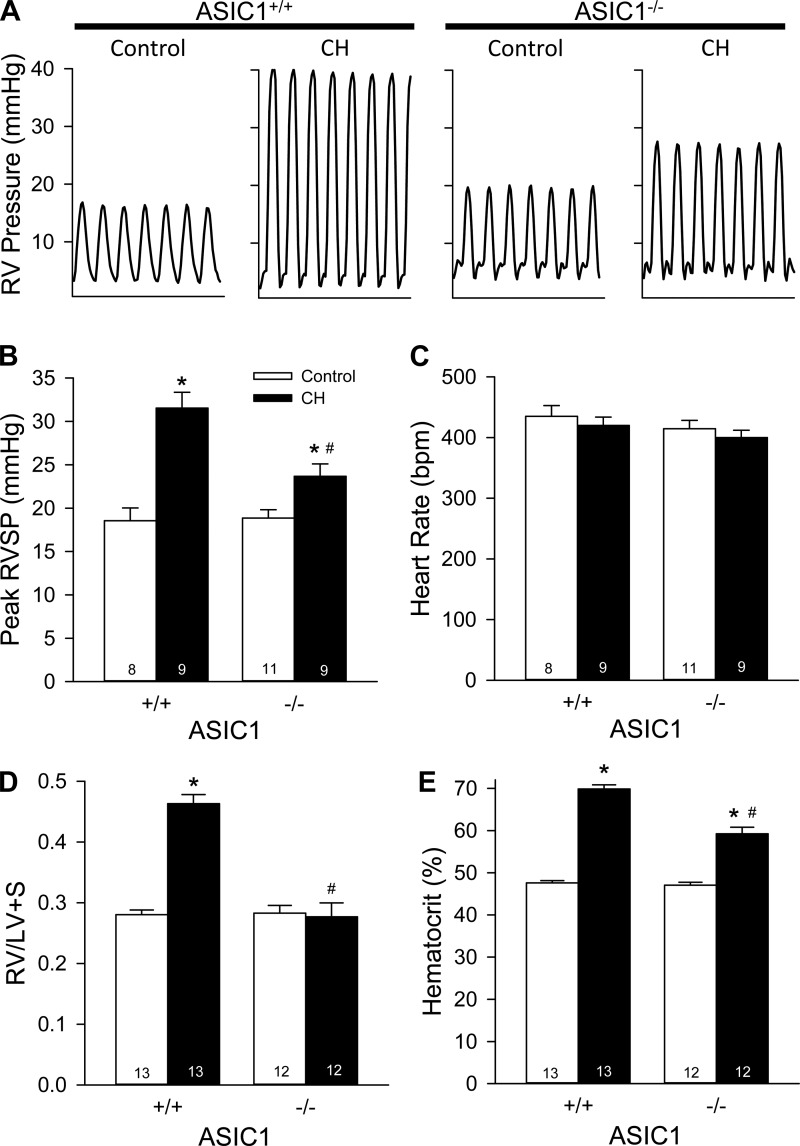
Fig. 7.
ASIC1 contributes to CH-induced pulmonary hypertension. A: representative traces of transdiaphragmatic measurements of right ventricular (RV) pressure. B and C: summary data for RV systolic pressure (RVSP; B) and heart rate [HR; in beats/min (bpm); C] in anesthetized control and CH ASIC1+/+ and ASIC1−/− mice. D and E: ratio of RV to left ventricular plus septal (LV + S) heart weight (D) and hematocrit (in %; E) in ASIC1+/+ and ASIC1−/− mice exposed to control or CH conditions. Values are means ± SE; n = 8–13 animals/group. *P < 0.05 vs. the control group; # P < 0.05 vs. the corresponding ASIC1+/+ mice.

