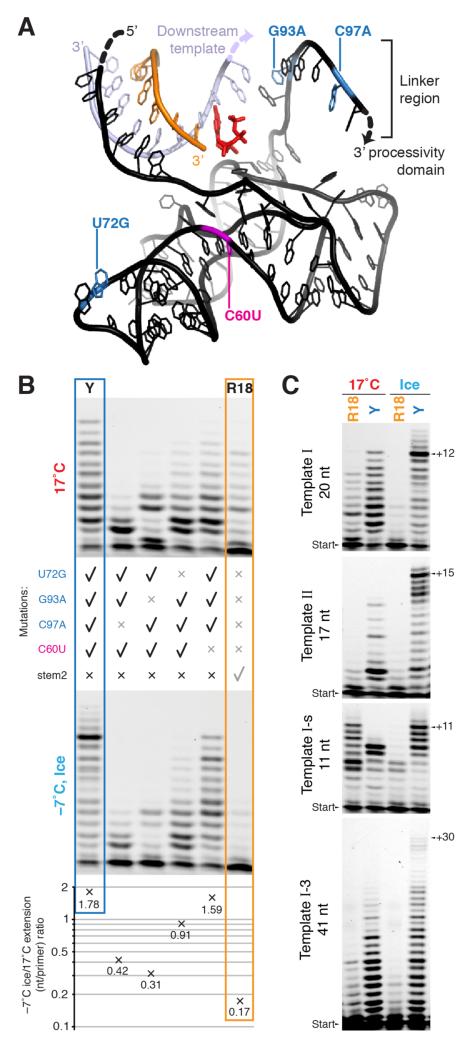
Figure 3. Basis of cold adaptation.
a, Representation of the relative positions of primer (orange), template (lilac) and catalytic core of Y (black), modelled on shared regions in the crystal structure of the progenitor class I ligase ribozyme30. The incoming NTP (red) is positioned at the 3′ end of the primer, and the locations of the four mutations comprising Y are highlighted. The indicated single-stranded downstream template and the linker region leading to the processivity domain (not shown) are likely flexible in the polymerase. b, Backmutation analysis of Y to uncover contributions to cold adaptation. Denaturing PAGE of extension (3 days, primer A / template I) at 17°C (top panel) and at −7°C in ice (lower panel), by R18, Y, and four reversion mutants of Y as indicated. These extensions were quantified (average nucleotides added/primer), allowing calculation of the ratio of observed extension in ice versus 17°C for each ribozyme, varying ~10-fold between Y and R18 (bottom panel). c, Influence of template length (indicated) and sequence on extension by R18 and Y (denaturing PAGE of extensions of primer A upon different templates at 17°C and at −7°C in ice (7 days)).

