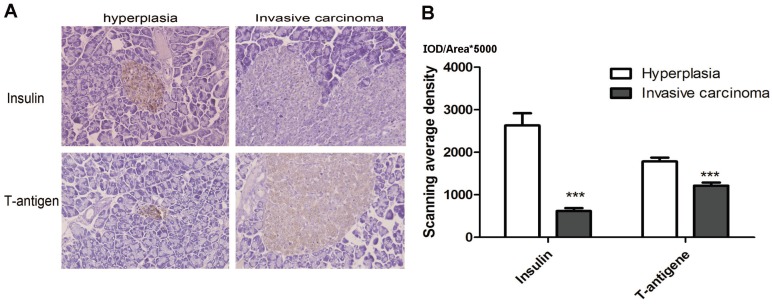
Fig 5.
Insulin and T antigen low-expression invasive carcinoma. A. Representative image of Insulin and T-antigen IHC in Hyperplasia (left, 4 weeks) and invasive carcinoma (right, 14 weeks) (magnification: ×1000). B. The results showed insulin and T-antigen down-regulation in hyperplasia comparison with invasive carcinoma (***P<0.01). The mean gray level IOD/Area was used to analysis in 10 fields, the color stained brown was objective to analyze (HRP-DAB).

