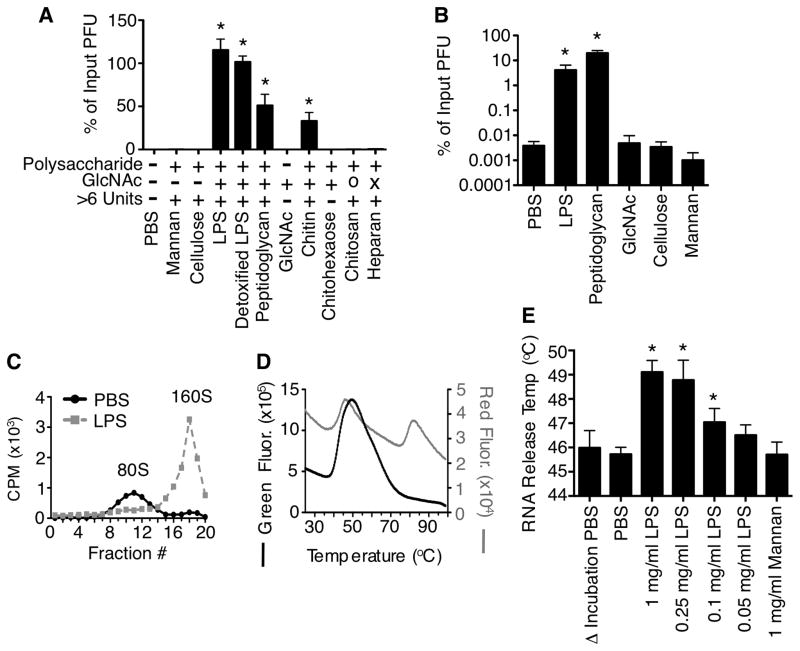
Figure 1. Bacterial surface polysaccharides enhance poliovirus stability in vitro.
(A) GlcNAc-containing polysaccharides enhance poliovirus stability. WT Mahoney poliovirus (1×10⁶ PFU) was incubated with indicated compounds (1 mg/ml) at 42°C for 6 h, followed by HeLa cell plaque assay. Input poliovirus titers were set to 100% and data are shown as % of input PFU. O=deacetylated chitin (chitosan); X=contains sulfate groups (heparan); n=5–9. (B) Bacterial polysaccharides enhance viral recovery following bleach treatment. WT Mahoney poliovirus was incubated with indicated compounds (1 mg/ml) at 37°C for 1 h followed by treatment with 0.1mg/ml bleach for 1 min and plaque assay; n=5–8. (C) Incubation with LPS limits virion inactivation as measured by gradient virion density analysis. 35S-labeled poliovirus was incubated with PBS or 1 mg/ml LPS at 42°C for 1 h prior to loading on 10–30% sucrose gradients. Gradients were subjected to ultracentrifugation and fractions were collected from the top of the gradient and scintillation counted. 160S=intact particles; 80S=empty particles. Graph is representative of 3 experiments. (D) Poliovirus thermostability profile using a cell-free Particle Stability Thermo Release assay (PaSTRy). Virus was added to SYBR Green or SYPRO Red and placed in a real-time PCR machine. Samples were heated from 25°C to 99°C on a 1% stepwise gradient with florescence monitoring. Peaks correspond to RNA release (SYBR Green) and capsid structural transitions (SYPRO Red). Graph is representative of three experiments. (E) Quantification of PaSTRy experiments revealing GlcNAc polysaccharides enhance thermostability of poliovirus by preventing premature RNA release. Poliovirus was incubated with indicated compounds at 37°C for 1 h prior to addition of SYBR Green and analysis with a real-time PCR machine; n=3–9. See also Fig. S1. Data are mean +/− SEM; * = P<0.05.

