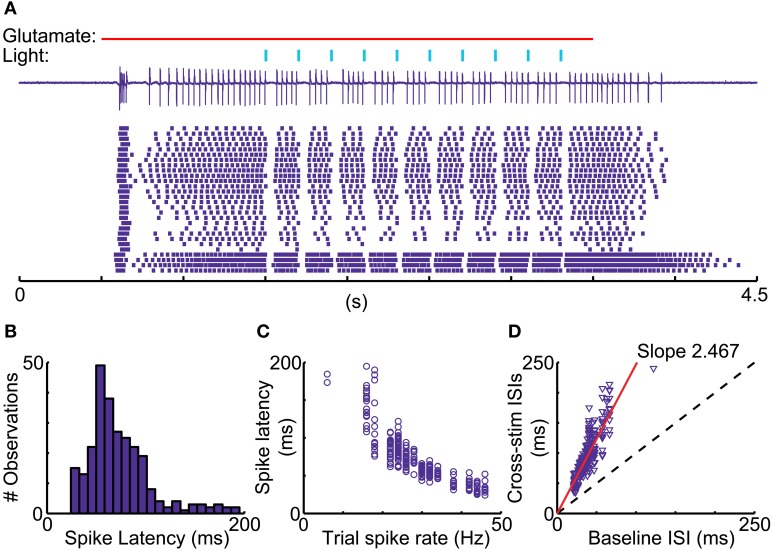
Figure 8.
Variable duration of spike pauses with nigral IPSP. (A) Sample cell-attached current trace and raster plot of 28 stimulus repetitions for a 5 Hz train of 10 ms light pulses during glutamate excitation. Note the lack of alignment of the first spike following pauses. (B) Latency histogram of first spike after the onset of optical light pulses. (C) Scatter plot of first-spike latency against the baseline spike rate during each trial measured in the 500 ms before the first light pulse. (D) Scatter plot of ISI, in which the stimulus occurs, vs. mean trial baseline ISI.

