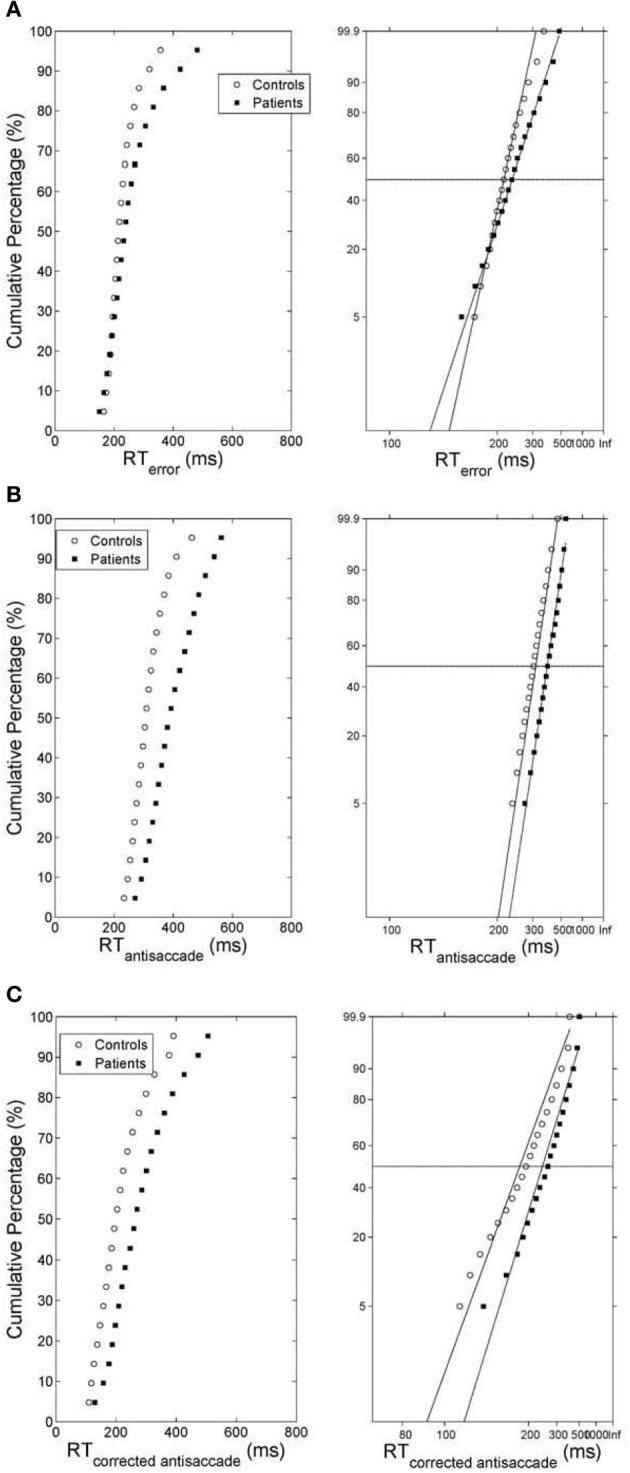
Figure 4.

(A) (Left) Average cumulative distribution of error prosaccade RT for controls (white empty circles) and patients (black squares). (Right) Reciprobit plots of the average cumulative error prosaccade RT distributions. The x-axis represents 1/RT and it has been reversed so that RTs increase to the right. Instead of 1/RT values the axis is marked with the corresponding RT values. The fitted lines correspond to linear regression on the data of each distribution (controls vs. patients). (B) (Left) Average cumulative distribution of antisaccade RT for controls (white empty circles) and patients (black squares). (Right) Reciprobit plots of the average cumulative antisaccade RT distributions. The x-axis represents 1/RT and it has been reversed so that RTs increase to the right. Instead of 1/RT values the axis is marked with the corresponding RT values. The fitted lines correspond to linear regression on the data of each distribution (controls vs. patients). (C) (Left) Average cumulative distribution of corrected antisaccade RT for controls (white empty circles) and patients (black squares). (Right) Reciprobit plots of the average cumulative corrected antisaccade RT distributions. The x-axis represents 1/RT and it has been reversed so that RTs increase to the right. Instead of 1/RT values the axis is marked with the corresponding RT values. The fitted lines correspond to linear regression on the data of each distribution (controls vs. patients).
