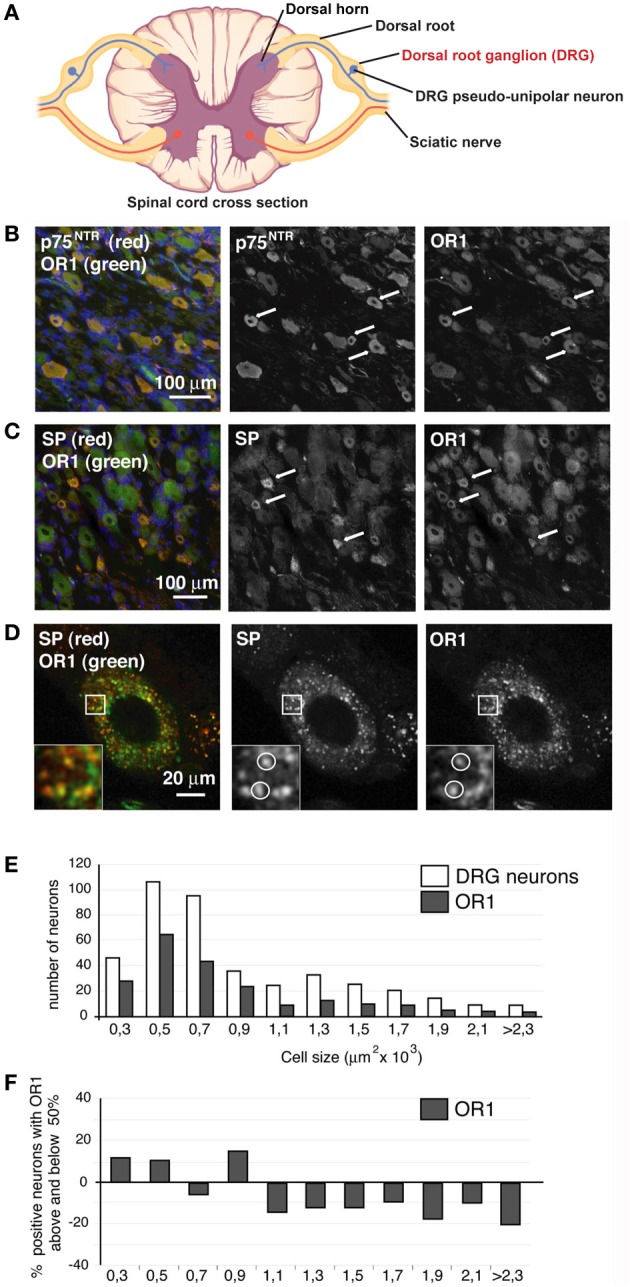
Figure 2.

OR1 is present in DRG neurons. (A) Scheme. DRG, site of analyses presented below, is indicated in red. (B) DRG neurons stained for p75NTR (red) and OR1 (green), nuclei were stained in blue with DAPI. Most p75NTR neurons were OR1 positive (arrows). (C) DRG neurons stained for SP (red) and OR1 (green). All SP positive neurons were strongly positive for OR1. (D) SP (red) and OR1 (green) showed a punctuated pattern as well as a clear colocalization in a third of SP puncta. (E) Size distribution of OR1 in DRGs compared to the size distribution of all DRG neurons. (F) Percentage of DRG neurons of a given size positive for OR1 (the numbers are given as percentage above and below 50%; baseline 0 corresponds to 50% of neurons positive for OR1). Arrows and white circles denote colocalization.
