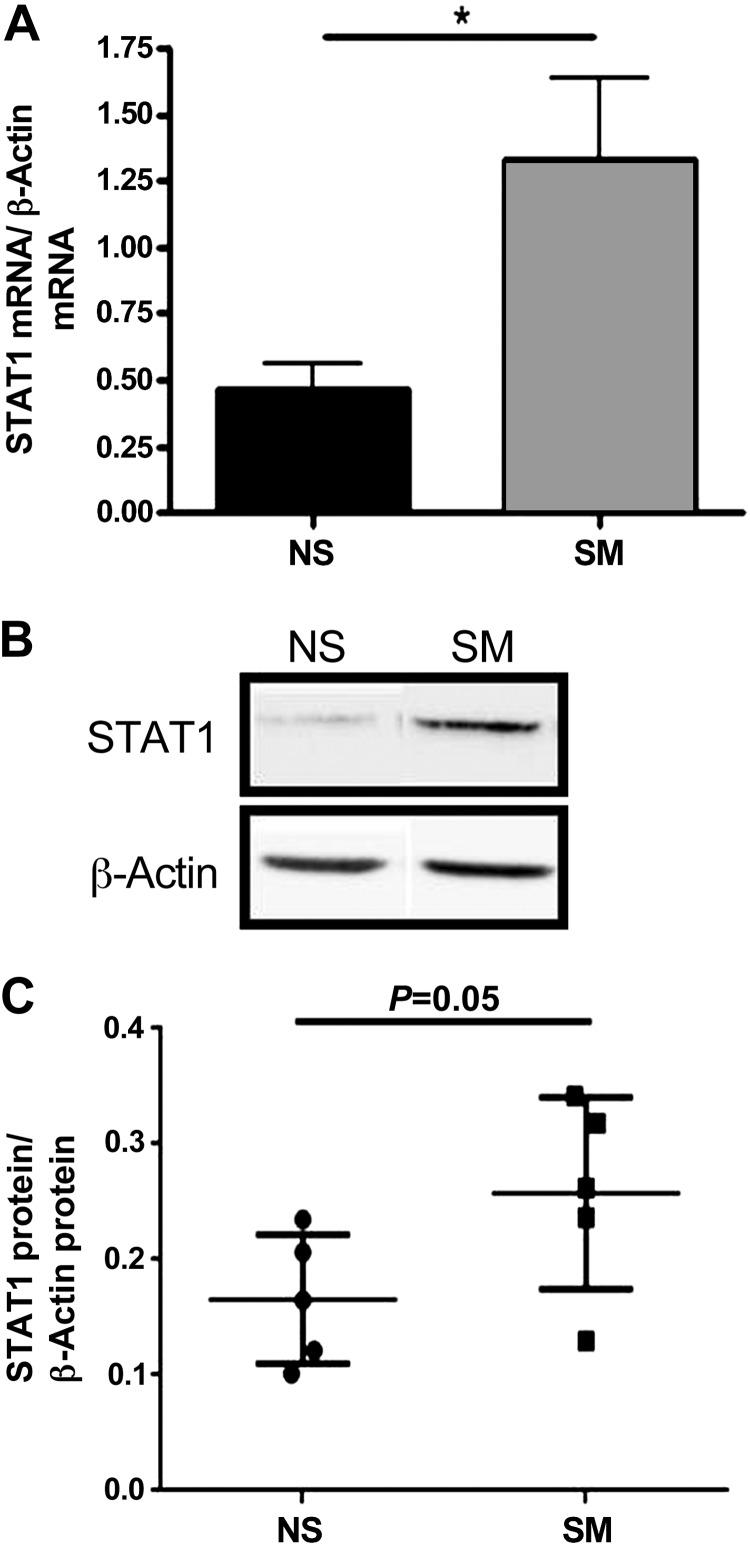
Fig. 4.
STAT1 mRNA and protein levels in NECs from NS and SM. A: STAT1 mRNA expression was examined by qRT-PCR and normalized to β-actin levels in NECs from NS and SM. B and C: intracellular STAT1 protein levels were examined by Western blot and analyzed by densitometry in NECs from NS and SM. In B, samples were run on the same blot but were nonadjacent. The 2 images were spliced together to form the figure as denoted by the black separating line. n = 5 NS and SM. *P ≤ 0.05.

