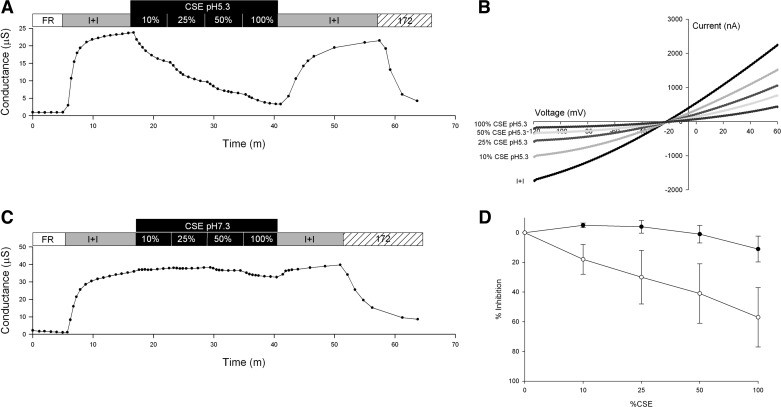
Fig. 4.
Representative traces of conductance and I-V plots of oocytes expressing CFTR and βAR. A: conductance of an oocyte perfused with FR, then activated with I+I, followed by sequential 5-min exposures to pH 5.3 CSE containing I+I at 10, 25, 50, and 100% concentrations, the CSE was then washed out with I+I pH 7.3, and lastly 20 μM CFTRinh-172 in I+I was applied. B: I-V plot of peak activation with I+I and after 5-min exposure to CSE pH 5.3 at 10, 25, 50, and 100% concentrations C: conductance of an oocyte perfused with FR, then activated with I+I, followed by 5-min exposures to pH 7.3 CSE containing I+I at 10, 25, 50, and 100% concentrations. The CSE was then washed out with I+I and lastly 20 μM CFTRinh-172 in I+I was applied. D: dose-response curve of CFTR % inhibition ± SD with increasing concentrations of CSE at pH 7.3 (●) and 5.3 (○).

