Fig. 8.
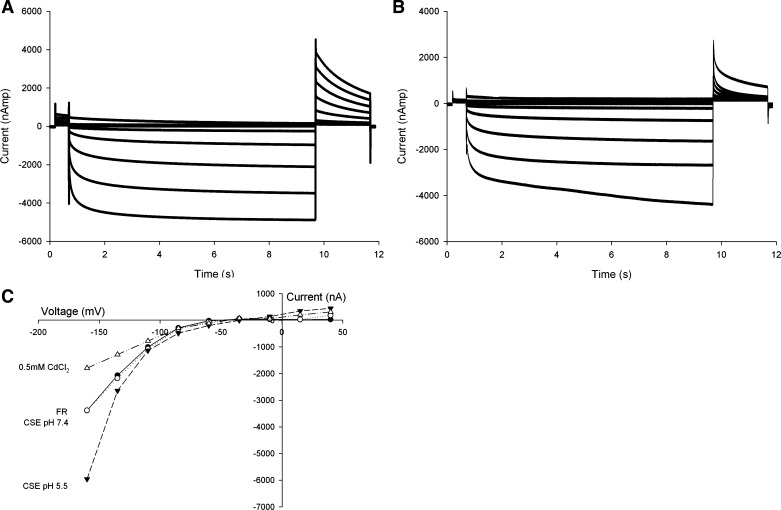
Representative traces of ClC-2 step protocol and current-voltage plot. A: current plot for ClC-2 activation in oocytes during a voltage-step protocol with 9-s membrane voltage step. B: same oocyte during CSE perfusion at pH 7.4. C: I-V plot of ClC-2 expressing oocyte. FR (solid line) and CSE (dotted line) at 7.4 show similar voltage-dependent activation. Exposure to CSE at pH 5.5 resulted in activation of ClC-2. Addition of 0.5 mM CdCl2 inhibited ClC-2 activation.

