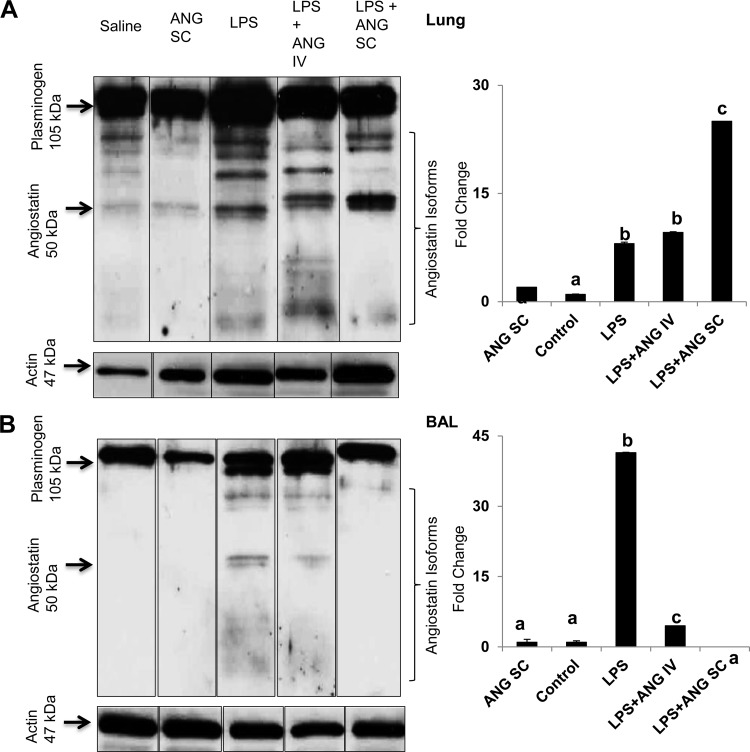
Fig. 7.
Representative Western blots of plasminogen and angiostatin (ANG) isoforms and densitometric analysis for 50 kDa ANG in lung homogenates (A) and bronchoalveolar lavage (BAL) fluid (B) from a 9-h study. The boxes around the lanes indicate that these were spliced and rearranged gel lanes obtained from gels run on a single day. Also shown is corresponding β-actin expression. y-axis represents fold difference in ANG expression after normalization for actin expression. a,b,cDifferent letters indicate statistical differences (P < 0.05) between the groups, while letters that match each other indicate no statistical difference.

