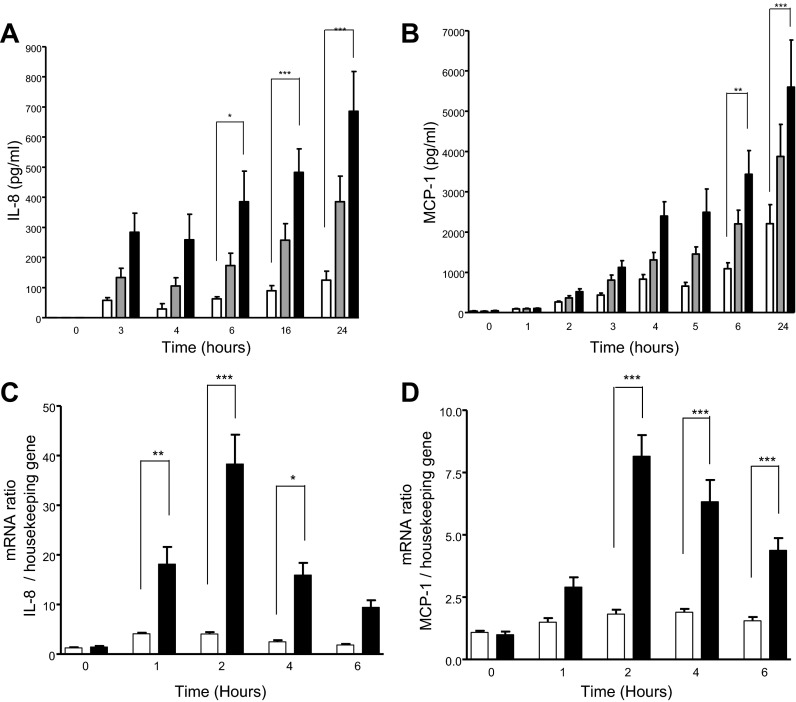
Fig. 2.
Time course of IL-8 and MCP-1 expression and release after methemoglobin challenge. A and B: A549 cells were incubated with 0 (open bars), 3 (shaded bars), or 10 μM (solid bars) methemoglobin for the times indicated. Levels of IL-8 (A) and MCP-1 (B) were determined in the supernatants by ELISA. C and D: A549 cells were incubated with 0 or 10 μM methemoglobin for the indicated times and RNA was extracted. Reverse-transcribed cDNA was subject to RT-PCR. Levels of IL-8 (C) and MCP-1 (D) mRNA are expressed as a ratio relative to the housekeeping gene. Data are expressed as means ± SE from 4 independent experiments. Comparison between conditions was made by 1-way ANOVA with Bonferroni posttest, *P < 0.05, **P < 0.01, and ***P < 0.001 compared with control at the indicated time points.

