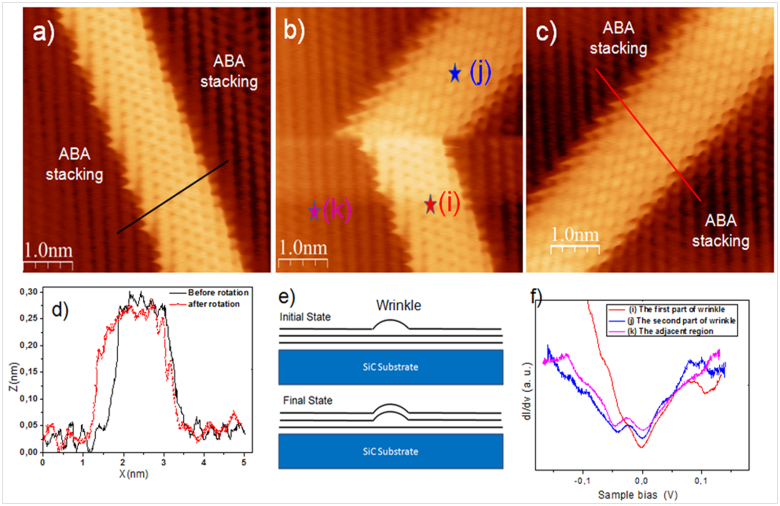
Figure 4. Different configurations of the wrinkles.
(a) STM image taken on an isolated wrinkle (Vs = −0.05 V, It = 0.2 nA): honeycomb structure on the wrinkle and triangular pattern on the adjoining graphene region; (b) STM image (Vs = −0.05 V, It = 0.2 nA) showing the partial rotation of the wrinkle under a tip-surface interaction effect (c) STM image (Vs = −0.05 V, It = 0.2 nA) showing that the wrinkle has entirely rotated by 60° from its original orientation; (d) Height profiles corresponding to the black (before rotation of the wrinkles) and red (after rotation of the wrinkles) lines in (a and c); (e) Schematic showing the modification of the wrinkle after the rotation; (f) Spatially averaged dI/dV curves at three different regions in figure 4(b).

