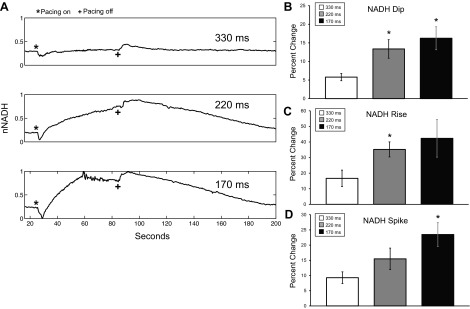
Fig. 3.

Effect of pacing rate on NADH in biventricular working hearts (n = 5). A: nNADH during 330-, 220-, and 170-ms pacing protocols in a biventricular working heart, where pacing was initiated at (*) and terminated at (+). Percent change in the magnitude of the nNADH change from baseline to dip at the onset of pacing (B), from baseline to maximal before pacing is terminated (C), and from the maximal to the spike offset of pacing (D) is shown. For all bar graphs: 330 ms (white), 220 ms (gray), and 170 ms (black). *P < 0.05 statistically different from 330-ms pacing.
