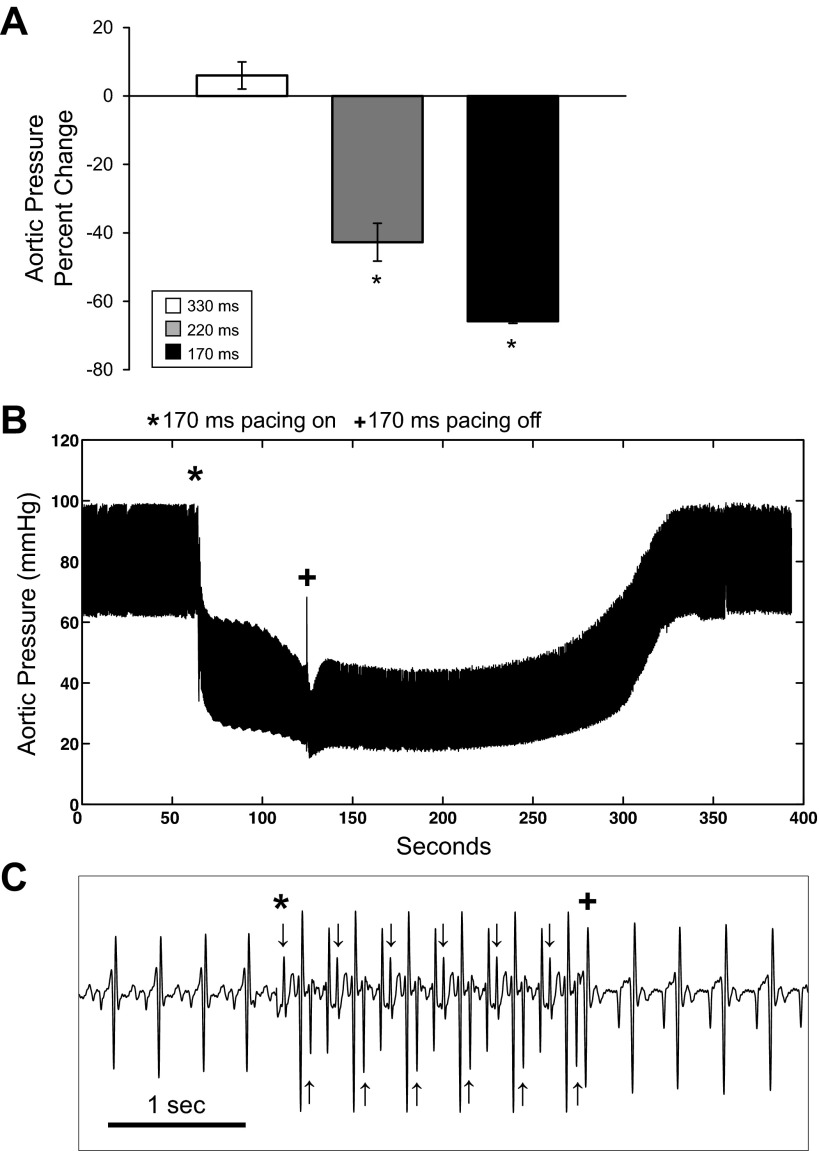
Fig. 4.
Effect of pacing rate on aortic pressure in biventricular working hearts (n = 5). A: percent change in aortic pressure at the onset of pacing for pacing at 330 ms (white), 220 ms (gray), and 170 ms (black). B: representative aortic pressure data from a working heart during a 170-ms pacing protocol, where pacing was initiated at (*) and terminated at (+). C: confirmation of pacing capture via ECG, where pacing was initiated at (*) and terminated at (+). Arrows correspond to pacing spikes. *P < 0.05 statistically different from 330-ms pacing.

