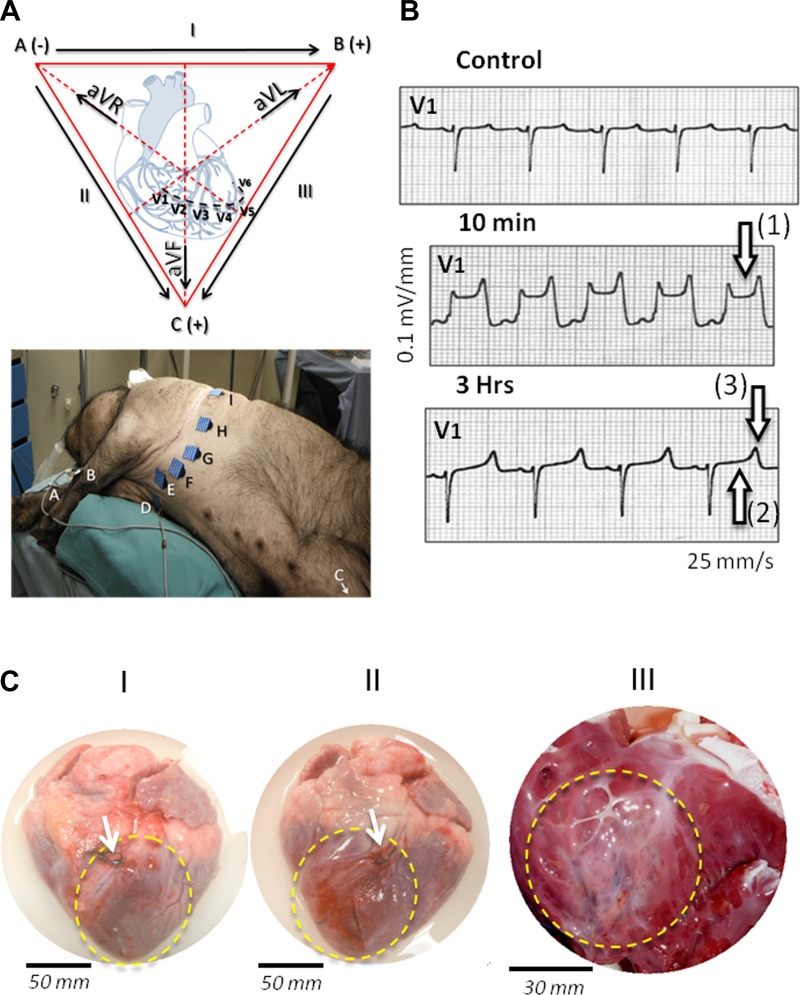
Fig. 2.
Development of myocardial infarction (MI) after left anterior descending (LAD) occlusion in Yucatan miniature swine. A: cardiac electrical activity was monitored by standard 12-leads ECG during the first hours following the coronary ligation. Bottom: positions of the electrodes on the animal; to facilitate the identification of the leads, letters on the electrodes refer to the Einthoven's triangle represented at top. B: under our experimental conditions, in swine (n = 6), evident signs of severe ischemia were detected on precordial leads (V1-V6, see A). The representative example of tracing on lead V1 is shown here before (control), 10 min, and 3 h after complete LAD coronary ligation; 10 min after ligation, significant ST elevation (≥0.1 mV) indicates ongoing infarction [see arrow (1)], whereas 3 h after ligation pseudonormalization of ST segment [arrow (2)] with peaked T wave [arrow (3)] and prolonged QT interval confirms an established myocardial injury. C: this first electrocardiographic estimate was confirmed later (here 72 h after coronary ligation) by visual inspection of the heart on 4 separate animals; these animals went through the same surgical procedure but were euthanized early in the 14-days blood sampling protocol. As shown in representative cardiac morphological changes (C, I and II), necrotic area (dashed yellow line) was readily visible downstream LAD coronary ligation (see white arrows). The infarction affected 20% to 30% of the left ventricular free wall, extending from the permanently occluded coronary segment down to the apex. As shown in C (III), the interior examination of the ventricular chamber confirmed the presence of large transmural myocardial injury in the left anterior wall.

