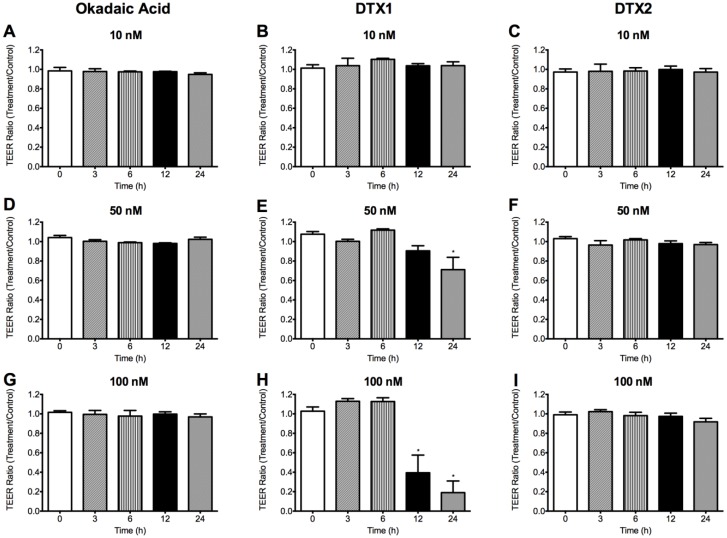
Figure 4.
Effects of OA, DTX1 and DTX2 on the trans-epithelial electric resistance (TEER) of differentiated Caco-2 monolayers. Figure shows the TEER ratio between toxin-treated monolayers and control monolayers. (A,D,G) Monolayers incubated with 10, 50 and 100 nM OA; (B,E,H) 10, 50 and 100 nM DTX1; and (C,F,I) 10, 50 and 100 nM DTX2. (*) Indicates statistically different value (p < 0.05) versus time 0 h. Reported values are the mean ± SEM of three independent experiments performed in duplicate.

