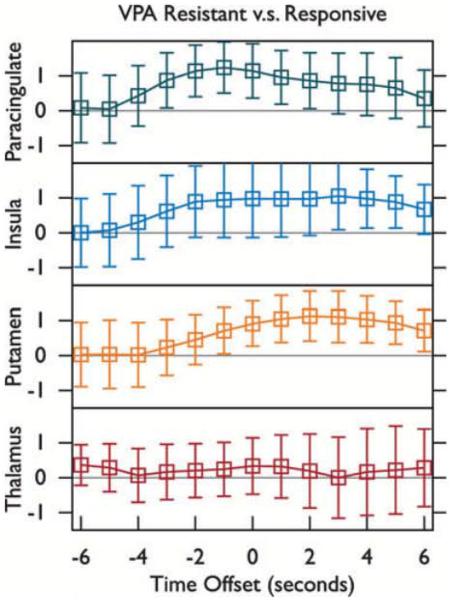
Figure 4.
A group level contrast for spike-related fMRI activation in valproate (VPA)-resistant versus VPA-responsive subjects was performed. The average and standard deviation of positive t-values within four regions of interest (ROIs, refer to Fig 2) are shown. Spike times obtained from a simultaneous EEG recording were convolved with a canonical gamma variate hemodynamic response function (HRF) with its peak 4.7 s post onset using AFNI. T-maps were produced with HRF onset aligned with spikes (0 s), before spikes (−1, −2, … s), and after spikes (+1,+2, … s).
Epilepsia © ILAE

