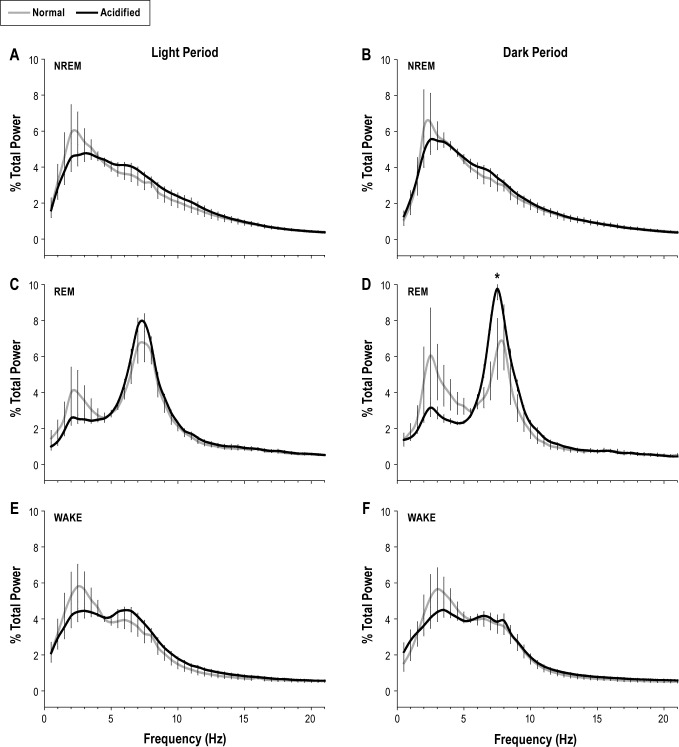
Figure 3.
State-specific electroencephalogram (EEG) power spectra are altered during musculoskeletal hypersensitivity. State-specific EEG power spectra were obtained from mice injected with either normal pH saline (n = 6; gray lines) or acidified pH saline (n = 8; black lines). Data presented were obtained 20 days following musculoskeletal sensitization (or control injections). Spectra were normalized as a percentage of total power within each frequency band during the 12-h light or dark period and are plotted as mean ± SEM for each frequency bin. Statistical analyses were performed on bins comprising the delta frequency band (0.5-4.5 Hz) and the theta frequency band (6.0-9.0 Hz) for NREMS and REMS, respectively. A significant change was detected between the peak theta frequency during the dark period for NREM sleep between injection groups on day 20. *P ≤ 0.05 vs. normal pH saline injection.

