Figure 3.
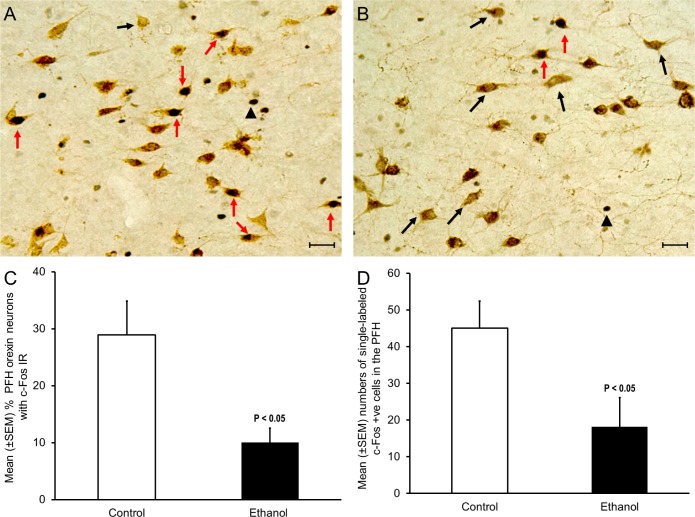
Effect of acute ethanol exposure on c-Fos expression in orexin neurons. (A) A representative photomicrograph describing orexin neurons with c-Fos immunoreactivity (IR) in controls. (B) A representative photomicrograph describing orexin neurons with c-Fos IR in the ethanol group. Red arrow = double labeled orexin and c-Fos +ve neuons; black arrow = single labeled orexin neurons; black arrowhead = single labeled c-Fos +ve cells. Calibration bar = 30 um. (C) The percentage of orexin neurons with c-Fos IR was significantly (P < 0.05) reduced after acute ethanol administration (n = 4; see text for details). (D) Ethanol administration significantly (P < 0.05) reduced the number of single-labeled c-Fos IR neurons in the orexinergic zone of perifornical hypothalamus.

